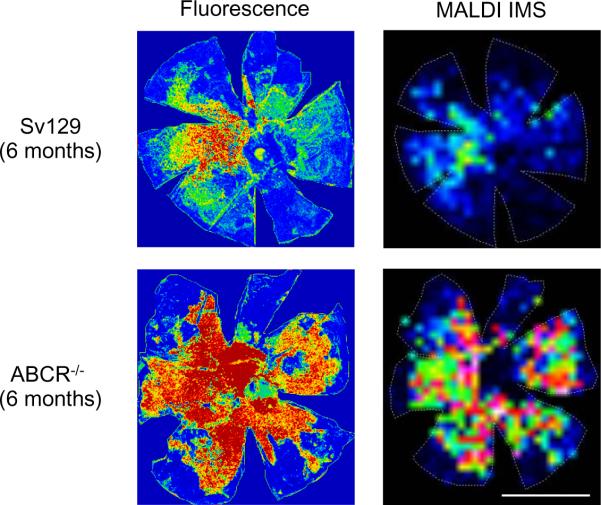
Figure 18. Lipofuscin fluorescence and MALDI images of A2E in mouse RPE.
RPE tissue images from 6-month-old Sv129 and Abca4−/− mice. Left panels: fluorescence intensity images; right panels: MALDI images of A2E in the same tissue. Fluorescence images were acquired as micrographs (λexc = 488 nm, λem = 565–725 nm, 10× objective, NA = 0.3) of individual fields and joined by overlapping areas. Images are shown at the same intensity scaling. The MALDI images were acquired after the tissue was spotted with MALDI matrix at 150 m resolution. The pixel intensity is proportional to A2E quantity, with the scale normalized to total ion current. All images are oriented as follows: dorsal (top); ventral (bottom); nasal (left, Sv129; right, Abca4−/−); temporal (right, Sv129; left, Abca4−/−). Scale bar, 1 mm.

