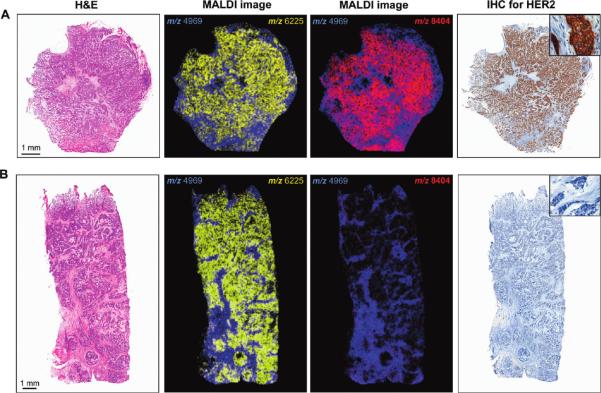
Figure 19. Distribution of cysteine-rich intestinal protein 1 in HER2-positive breast cancer.
m/z 8404 (shown in red) is up-regulated in HER2-positive breast cancer tissues: optical microscopic images of the MALDI-IMS measured and subsequently H&E stained original tissue sections of a HER2-positive (A) and a HER2-negative (B) case. Immunohistochemistry for HER2 of the respective case on a consecutive serial section is shown on the very right side. Note the strong immunoreactivity (score 3+) of the positive case (A), while the reaction in the negative case indicates a score 0 (B). The visualization of m/z 8404 by MALDI-IMS (shown in red) shows up-regulation in HER2-positive tissues (A) and clearly shows that this spectral feature is specific for cancer cells in this HER2-positive case but absent in cancer cells of the HER2-negative case (B). The spectral feature of m/z 6225 (shown in yellow) is an example specific for cancer cells but not distinguishing between HER2-positive and HER2-negative tissues and is therefore present in both cases (A and B); m/z 4969 (shown in blue) is a m/z species specific for tumor stroma and thus also present in both cases (A and B). Scale bars ) 1 mm. Reprinted with permission from Reference 199. Copyright 2010 American Chemical Society.

