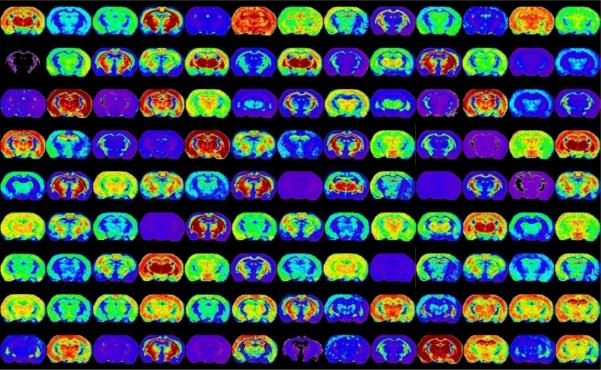
Figure 3. Dimensionality of MALDI IMS data sets.

Ion images displayed above originate from a single raster of one section of a mouse brain section. Each image represents a single m/z ion that has a unique distribution in the brain. This figure represents less than 10% of the images collected.
