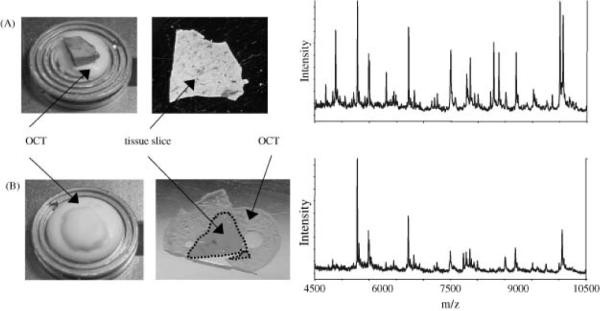
Figure 6. Effect of OCT on MALDI signal from rat liver.

(A) Optimal procedure where OCT is used to adhere the tissue to the sample stage but does not come into contact with the sliced tissue. The resulting spectrum shows many intense signals between m/z 4500 and 10 500. (B) The tissue was embedded in OCT and attached to the sample stage. The resulting tissue slice is surrounded by OCT on the MALDI plate, and the resulting spectrum contains only about half of the signals as that in (A). Reproduced with permission from Reference 45. Copyright 2003 John Wiley & Sons, Ltd.
