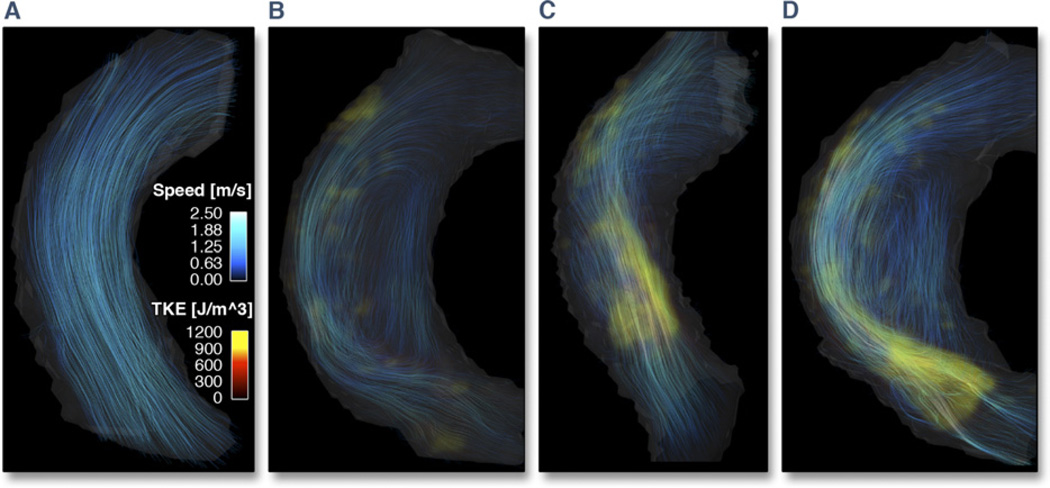
Figure 2. Visualization of Flow Patterns and TKE.
Visualization of flow patterns and turbulent kinetic energy (TKE) in 1 normal volunteer and 3 patients with aortic stenosis. For each subject, volume renderings of TKE (red to yellow color scale) at the time point of peak total TKE have been combined with streamline visualization of the instantaneous velocity field at the time of peak velocity (blue color scale). Color settings were the same in all subjects.

