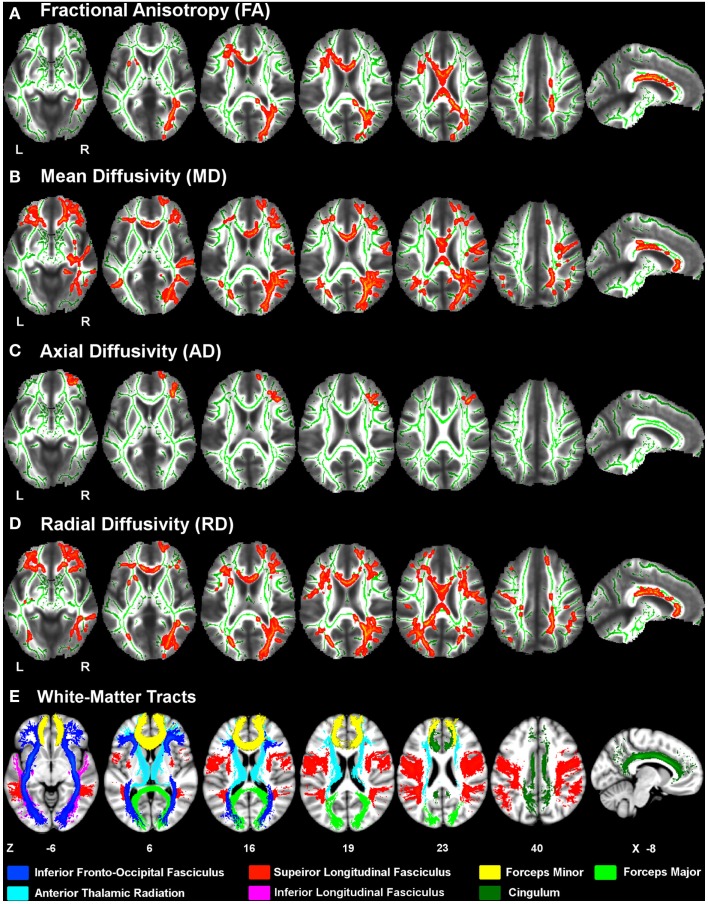
Figure 1.
White-matter diffusivity changes in Parkinson’s disease (PD). Axial and sagittal views of regions showing significantly lower fractional anisotropy (A) and higher mean diffusivity (B), axial diffusivity (C), and radial diffusivity (D) in the PD group relative to the control group (red clusters). The averaged FA-skeleton is displayed in green. Volumes of clusters showing significant change in PD were expanded on the figure to increase their visibility. White-matter tracts (E) showing significant diffusivity changes in PD were specified using the Johns Hopkins University (JHU) white-matter tractography atlas. Color labels for the JHU tracts are displayed at the bottom. Z coordinates (mm) of slices are from the Montreal Neurological Institute atlas. L, left hemisphere; R, right hemisphere.

