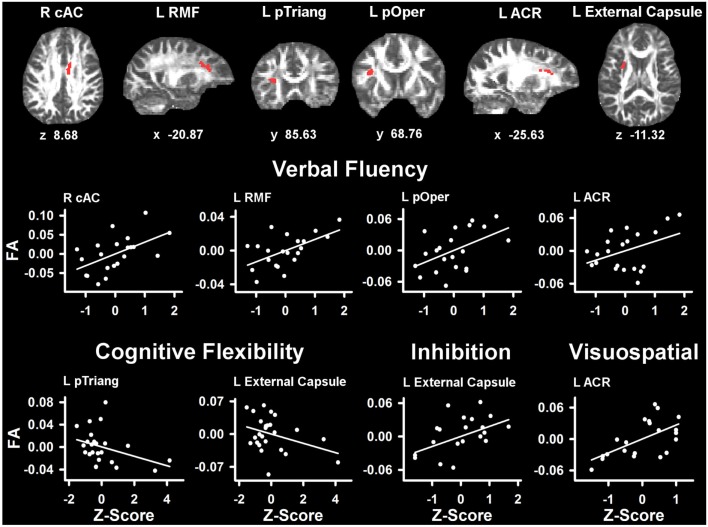
Figure 3.
Partial correlations between tests of executive and visuospatial functioning and fractional anisotropy (FA) in PD. Scatter plots show the relationship between verbal fluency, cognitive flexibility (Trails B-A), inhibition (Stroop Interference), and visuospatial (JOLT) functioning and FA in representative ROI. The values plotted for all measures are residuals from the regression of age and gender onto regional FA and cognitive performance. Cognitive measures were normalized to the control group by subtracting the individual raw scores for each measure from the control group mean and then dividing by the control group standard deviation. Higher Z scores reflect better performance, except for cognitive flexibility where higher values signify worse performance (i.e., longer time to complete Trails Part B after subtracting Part A performance). The spatial location of FA in each ROI is displayed in diffusion space for representative individual subjects. L, left hemisphere; R, right hemisphere; ARC, anterior corona radiata; cAC, caudal anterior cingulate; pOper, pars opercularis; pTriang, pars triangularis; RMF, rostral middle frontal. Coordinates designate distance in millimeters. from anterior commissure: x, left (−)/right (+); y, anterior (+)/posterior (−); and z, superior (+)/inferior (−).

