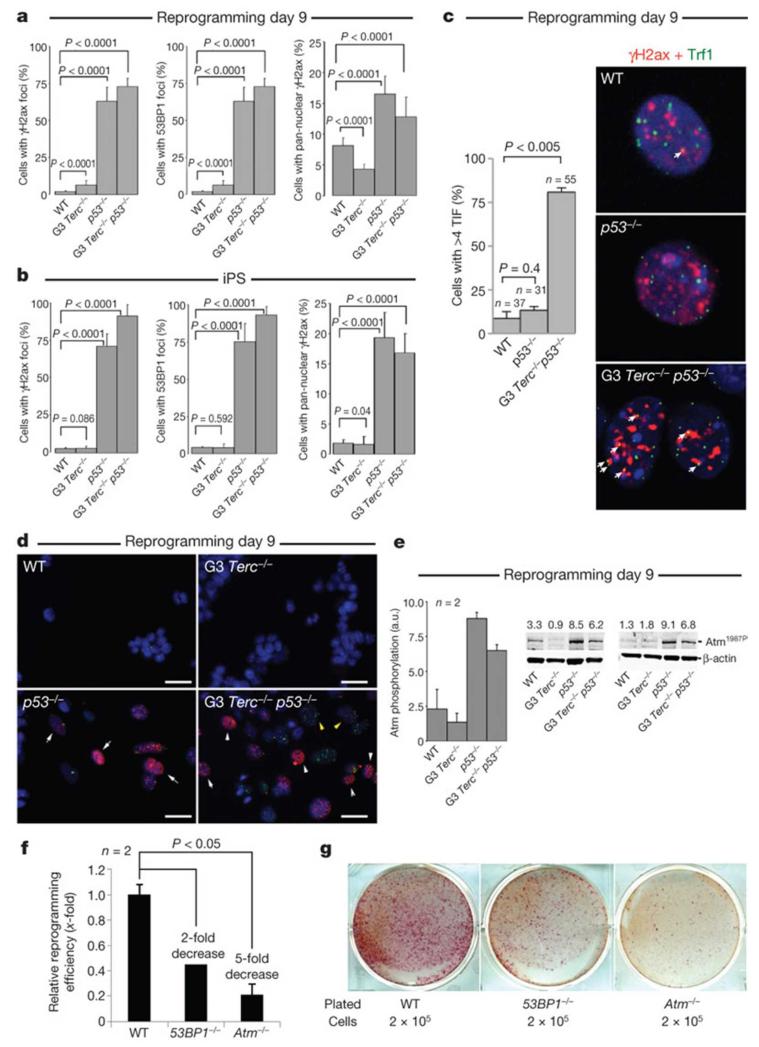
Figure 3. DDR activation during reprogramming.
a, b, γH2ax and 53BP1 foci 9 days after infection (a) and in iPS cell clones (b). Results are the mean of two experiments. Two-hundred cells were analysed per genotype/experiment. Error bars, s.d. c, Left, telomere-induced DNA damage foci (TIF) 9 days after infection. n = cells with γH2ax foci analysed. Values correspond to two reprogramming experiments. Error bars, standard error. Student’s t-test was used for statistics. Right, representative images of γH2ax (red) and Trf1 (green) staining. Arrows indicate co-localization events (yellow). Original magnification, ×63. d, Representative images that are quantified in a. White arrows, pan-nuclear γH2ax; yellow arrows, co-localization of γH2ax and 53BP1. Scale bars, 10 μm. e, Western blot (right) showing Atm phosphorylation 9 days after infection. Atm1987P denotes Atm protein phosphorylated at Ser 1987. Numbers above each lane represent the relative quantification of Atm levels. Two western blots were used for quantification (left). Error bars, standard deviation. f, Relative reprogramming efficiencies of 53BP1−/− and Atm−/− MEFs compared to wild-type MEFs. Fold changes are indicated. Student’s t-test is used for statistics. Error bars, standard error. n = experiments performed with independent MEF cultures. g, Reprogramming plates stained with alkaline phosphatase.

