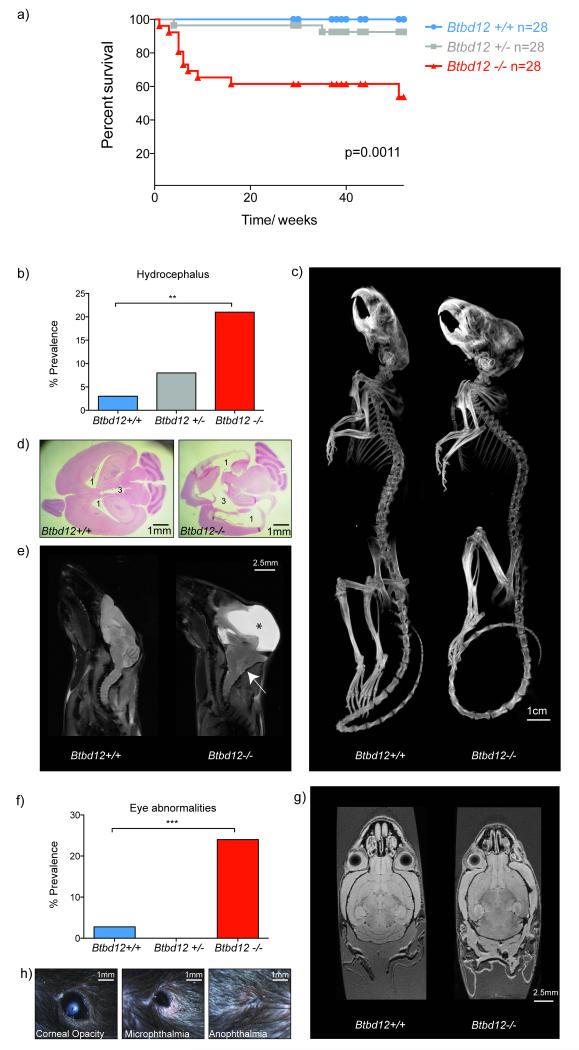
Figure 2. Some Btbd12−/− mice die prematurely and display brain and eye developmental defects.
a) Kaplan-Meier survival curve for cohorts of Btbd12+/+, Btbd12+/− and Btbd12−/− mice (n=28 per genotype, p=0.011), a sharp drop in survival is evident in the Btbd12−/− colony occurring within the first 3 months of life. b) An increased prevalence of hydrocephalus is observed among the cohort of Btbd12−/− mice. (**p=0.006, Fisher’s exact test; Btbd12+/+ n=3/72, Btbd12+/− n=13/163, Btbd12−/− n=10/48) c) High resolution X-ray CT of representative Btbd12−/− compared with littermate Btbd12+/+ control, a obvious skull deformity is apparent in the Btbd12−/− mouse (scale bar 1cm). d) H&E sectioned hydrocephalic brain from a Btbd12−/− mouse showing dilatation of the lateral ventricles (1) and rupture of the 3rd ventricle (3). (scale bar 1mm) e) High resolution MRI of a Btbd12+/+ animal compared with a hydrocephalic Btbd12−/− mouse. The image shows a large hydrocephalus (*), arrowhead points to disrupted brainstem structure (scale bar 2.5mm). f) An increased prevalence of a spectrum of eye abnormalities is observed in Btbd12−/− mice (*** p=0.0008, Fisher’s exact test; Btbd12+/+ n=2/71, Btbd12+/− n=0/163, Btbd12−/− n=11/48) g) High resolution MRI of representative Btbd12−/− compared with wild type littermate showing unilateral anophthalmia (scale bar 2.5mm). h) Slit-lamp images revealing the spectrum of ocular abnormalities observed in the cohort of Btbd12−/− animals (scale bar 1mm). These abnormalities range from corneal opacity (left), to microphthalmia (center) and finally anophthalmia (right).

