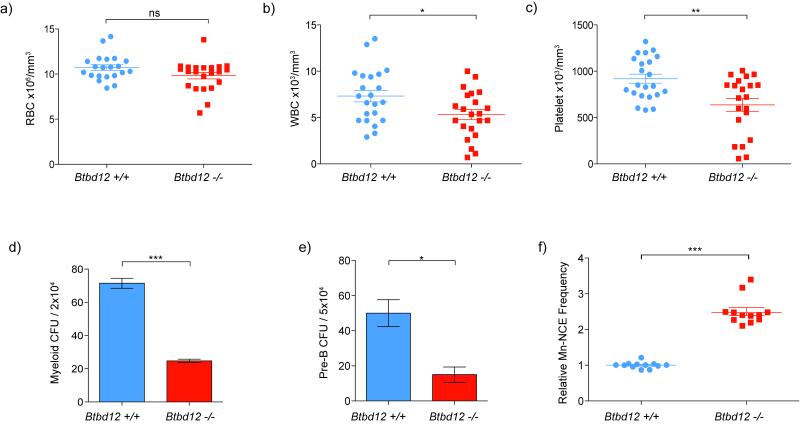
Figure 3. A proportion of Btbd12−/− mice develop blood cytopenias associated with genomic instability.
Full blood count analysis of 4-12 weeks old Btbd12−/− with wild type littermates a-c (n=22 for each group) a) Peripheral blood erythrocyte concentration, ns; not significant p=0.0617 b) Peripheral white cell concentration, *p=0.0155 – note a sub-population of markedly leukopenic animals. c) Peripheral thrombocyte concentration, **p=0.0027 – note a sub-population of severely thrombocytopenic animals. (in a-c central line represents mean and error bars standard error of mean) d) Proficiency of Btbd12+/+ and Btbd12−/− bone marrow progenitor cells to form myeloid colony forming units (CFU) from 2×10⁴ nucleated bone marrow cells. Data obtained from the average of results obtained from 3 individual mice (***p<0.0001, bar represents mean of three independent experiments and error bars standard error of mean) e) Lymphoid linage was assessed through the ability of bone marrow cells to form Pre-B cell CFU per 5×10⁴ bone marrow cells (average 3 independent mice, *p=0.017, bar represents mean of three independent experiments and error bars standard error of mean). f) Flow cytometric analysis revealing the frequency of micronucleated normochromic erythrocytes (Mn-NCE) in peripheral blood of unchallenged 16-week-old Btbd12+/+ and Btbd12−/− mice (n=12 per genotype, ***p<0.0001, central line represents mean and error bars standard error of mean). Micronuclei are a marker for genomic instability.

