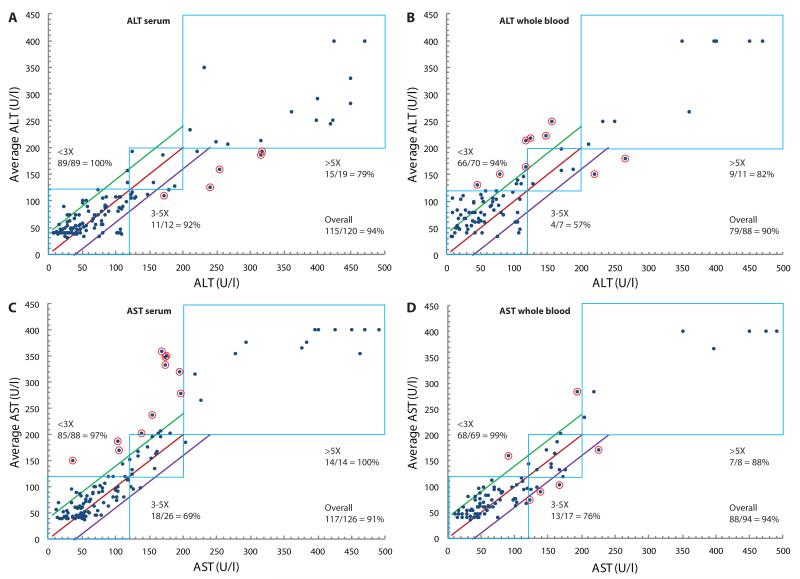
Fig. 3.
Direct comparison of transaminase measurements made with the paper-based device to those made with the standard automated method. (A to D) ALT values in paired serum (A) and whole blood (B) clinical specimens and AST values in paired serum (C) and whole blood (D) clinical specimens are plotted against values (in U/l) measured in the serum specimen using a gold-standard automated method (Roche Modular Analytics System). Results for each whole blood specimen (n = 1 per reader) were averaged from 3 blinded readers to generate each datum. All serum specimens with sufficient volume remaining after initial testing were stored at 4°C for up to 2.5 weeks and blindly retested in triplicate (three readers blinded to automated results read each of up to three assays performed per specimen) and then averaged. In each plot, the blue boxes represent AST or ALT “bins” within which values for both the paper-based device and the automated method are within the same range: <3× ULN (0-119 U/l), 3-5× ULN (120-200 U/l), or >5× ULN (>200 U/l). The red line corresponds to the line of equality, and the green and purple lines correspond to ±40 U/l from the line of equality, respectively. Points circled in red are samples that were neither in the correct bin nor within 40 U/l of the value measured by the gold-standard automated method. For scaling purposes, x-axis values measured by the Roche system that exceeded 400 U/l were plotted between 400 and 500 U/l.

