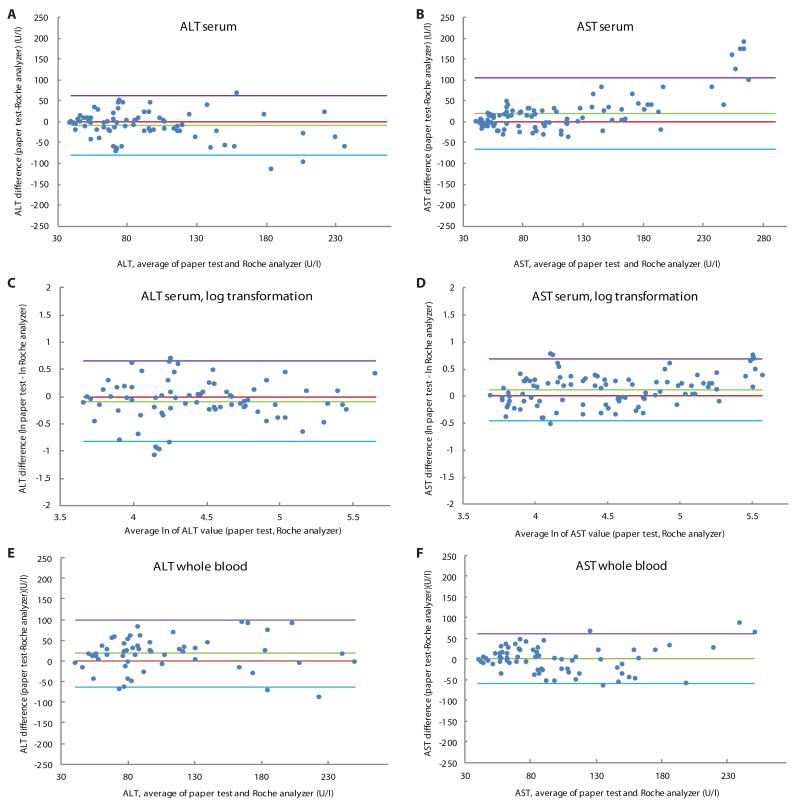
Fig. 4.
Bland-Altman plots of visual transaminase measurements in clinical specimens. (A) ALT values in serum. (B) AST values in serum. (C) ALT values in serum (after log transformation). (D) AST values in serum (after log transformation). (E) ALT values in whole blood. (F) AST values in whole blood. The purple and blue lines represent the 95% limits of agreement. The red line is the line of equality and the green line is the average difference of the methods. Values are derived from the difference between the gold-standard method (Roche) and the paper test value (average of all recorded values per sample) (supplementary methods).

