Fig 2.
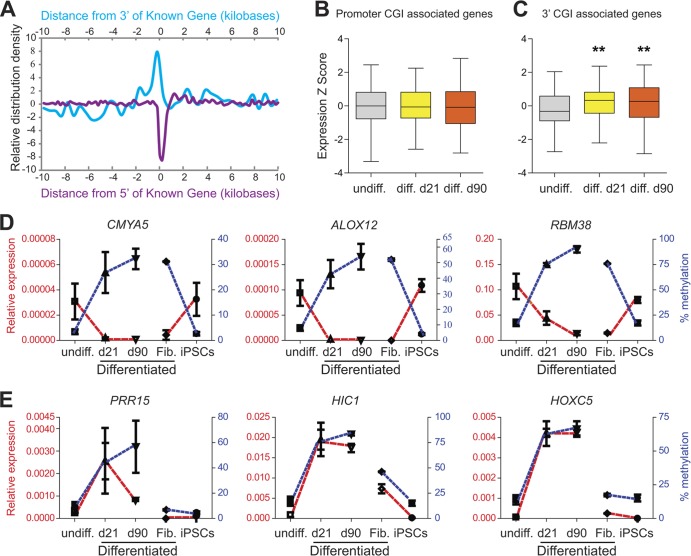
Promoter and 3′ CGI methylation exhibit opposite correlations with expression. (A) CGIs that gained methylation during differentiation are underrepresented at 5′ ends (purple) but enriched at the 3′ ends of known genes (blue). (B) Box plot showing normalized gene expression levels (by microarray) for genes associated with increased methylation at promoter CGIs upon induced differentiation. Compared to undifferentiated hESCs, the significance of difference was P = 0.30 at day 21 and P = 0.02 at day 90 (based on expression data of 224 genes in four biological replicates per group). (C) Box plot showing gene expression levels (by microarray) for genes associated with increased methylation at 3′ CGIs upon induced differentiation. Compared to undifferentiated hESCs, the significance of difference was P = 7.35E−08 at day 21 and P = 1.60E−07 at day 90 (based on expression data of 74 genes in four biological replicates per group). (D and E) Quantitative measurements of DNA methylation (blue) and gene expression (red) dynamics at promoter CGI-associated genes (D) and 3′ CGI-associated genes (E) upon induced differentiation and dedifferentiation. In all cases, methylation at promoter CGIs is inversely correlated with expression, but methylation at 3′ CGIs is positively correlated with expression.

