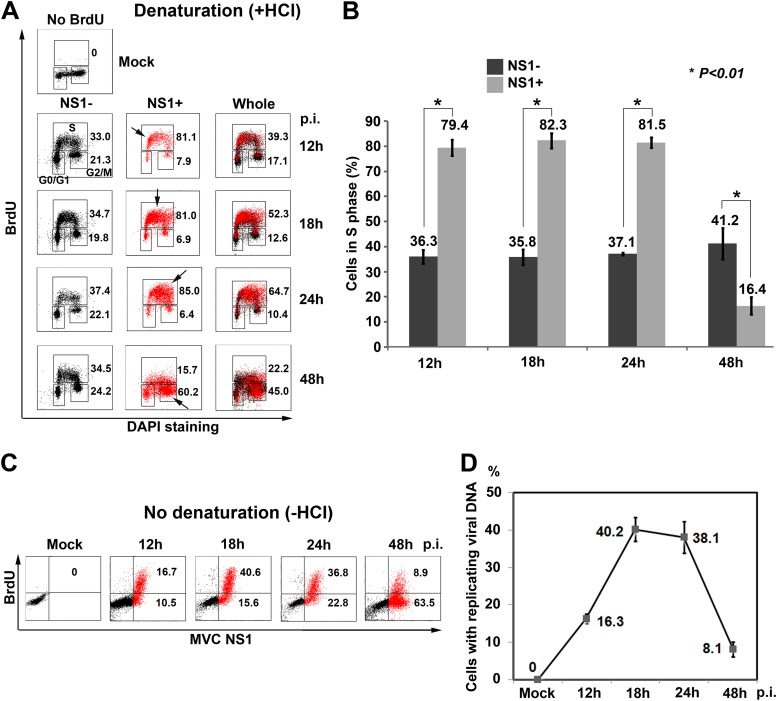
Fig 2.
MVC DNA replication arrests host cells in S phase. (A and B) Flow cytometry analysis of the cell cycle. (A) At the indicated times p.i., mock- or MVC-infected cells were BrdU labeled, treated with HCl (+HCl), stained, and analyzed by flow cytometry. Unlabeled mock-infected cells were used as a negative control for anti-BrdU staining. Both the NS1-positive (NS1+, marked in red) and -negative (NS1−, marked in black, bystander of whole population) cell populations in infected cells were gated. The percentage of cells in each phase was gated in the NS1+ and NS1− cell populations and in the whole population (whole) based on the intensity of BrdU staining and DNA content. Numbers show percentages of cells in S phase (upper) and G2/M phase (lower) in each histogram. Arrows indicate the most concentrated cell population. (B) The percentages of cells in S phase are shown as means (numbers) and standard deviations (error bars) and were generated from at least three independent experiments. P values were determined using Student's t test. (C and D) Flow cytometry analysis of viral DNA replication. (C) At the indicated times p.i., mock- or MVC-infected cells were incubated with BrdU for 1 h. The cells were costained with anti-NS1 and anti-BrdU antibodies and DAPI and analyzed by flow cytometry. NS1+ cells were marked in red. Numbers shown in the histograms indicate percentages of cells with BrdU incorporation from one representative experiment. (D) The percentages of BrdU-positive (BrdU+) cells are plotted to the time points p.i. Averages and standard deviations are shown at each time point and were obtained from at least three independent experiments.

