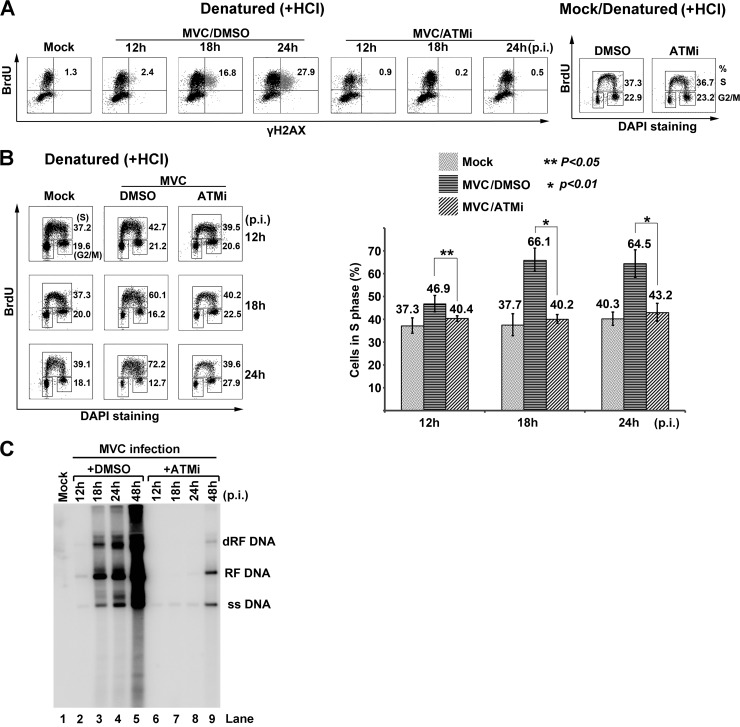
Fig 5.
MVC infection-induced S-phase arrest is regulated by ATM signaling. (A and B) Flow cytometry analysis of DDR. WRD cells were infected with MVC or mock infected and were treated with ATMi or DMSO. At the indicated times p.i., the cells were incubated with BrdU for 1 h. (A) Labeled cells were treated with HCl and then costained with anti-γH2AX and anti-BrdU antibodies for flow cytometry analysis. Numbers in each histogram show percentages of both BrdU- and γH2AX-positive cells. A cell cycle analysis of ATMi-treated mock-infected cells is shown on the right side. Treated cells were costained with an anti-BrdU antibody and DAPI. Numbers show percentages of cells in S phase (upper) and G2/M phase (lower), respectively. (B) Labeled cells were treated with HCl and then costained with an anti-BrdU antibody and DAPI for cell cycle analysis. The whole-cell population in S phase, either treated with ATMi or DMSO, and mock-infected cells were quantified at the indicated times p.i., and data are shown as means ± standard deviations. P values were determined using Student's t test. (C) Southern blot analysis of viral DNA replication. MVC-infected cells treated with either DMSO control or ATMi were collected for preparation of Hirt DNA at the indicated times p.i. Samples were analyzed by Southern blotting. Mock-infected cells were used as a negative control. RF DNA, replicative form DNA; dRF DNA, double RF DNA; ss DNA, single-stranded DNA.

