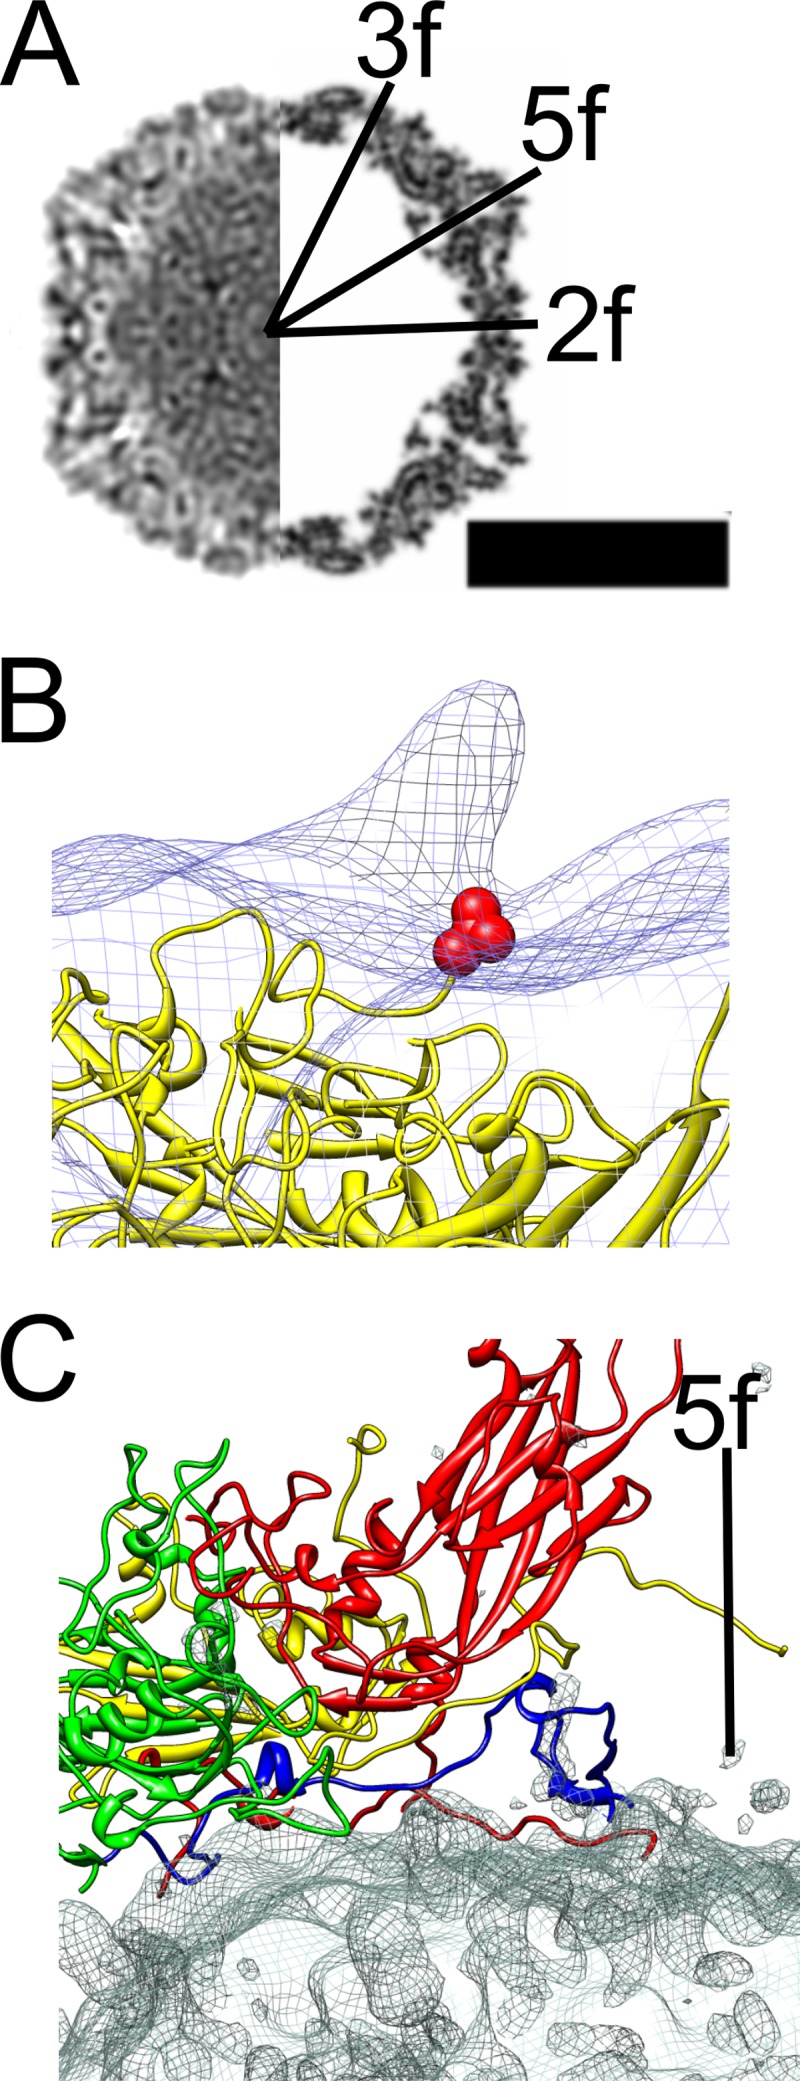
Fig 2.

Comparison of the atomic model of CVA9 with the CVA9-integrin complex model. (A) Central cross-section view of icosahedrally symmetric filled CVA9 capsid-integrin αvβ6 density (left side) and central cross-section of simulated density for the CVA9 atomic model (PDB 1d4m; right side) (12, 44), with the symmetry axes marked 3f, 2f, and 5f. Protein and RNA are shown in black. Bar, 15 nm. (B) Comparison of asymmetric reconstruction of the filled CVA9 capsid-integrin αvβ6 complex (wire net) with the CVA9 atomic model (yellow ribbon model). The integrin density seen as a protrusion in the wire net is from a position that is symmetry related with respect to the one enforced during alignment. The integrin is on top of the VP1 C terminus shown as a red ball model of valine 284. (C) The interaction of a single protomer of CVA9 (VP1, red; VP2, green; VP3, yellow; VP4, blue) with the difference map (wire net) created by subtracting the CVA9 atomic model from the icosahedrally symmetric filled CVA9 capsid-integrin αvβ6 density. The density mainly represents RNA.
