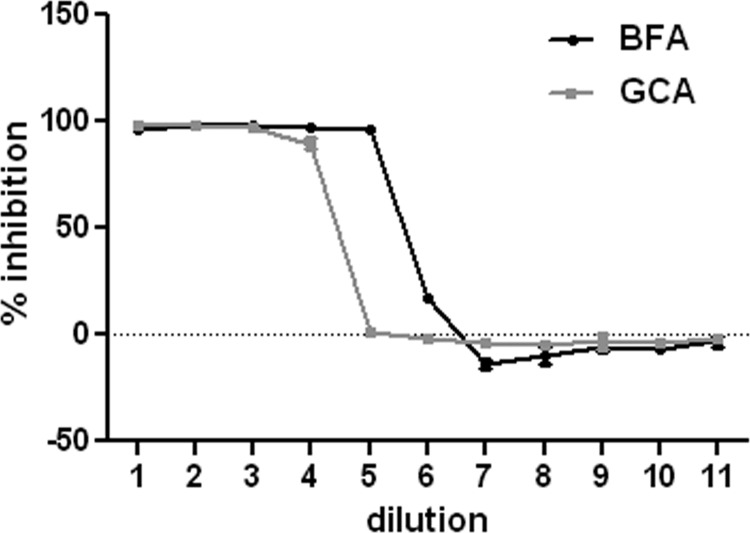
Fig 3.
Inhibition profiles of BFA and GCA. HaCaT cells were incubated with a dilution series of either BFA or GCA, and infection with a GFP-expressing pseudovirus was allowed to continue for 48 h. Following this, GFP expression was determined by flow cytometric analysis. The percent inhibition was determined by comparison to control infections. The results from triplicate infections are shown. The starting concentration of BFA was 150 nM, and 11 3-fold dilutions were examined. The starting concentration of GCA was 5 μM, and 11 2-fold dilutions were examined.

