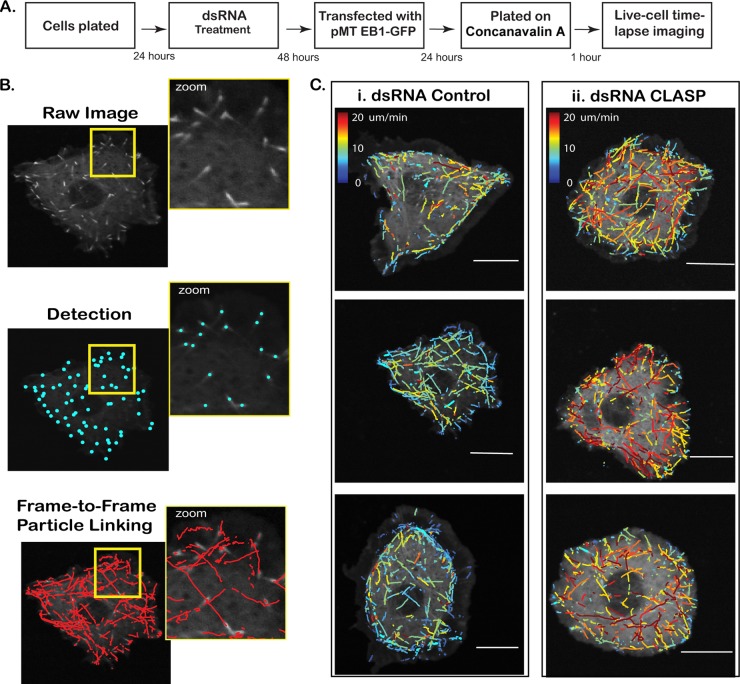
Fig 3.
Analysis using plusTipTracker. (A) Work flow of ex vivo assay evaluating the effect of candidate CLASP-interacting proteins on MT dynamics. (B) (i) Cells expressing EB1-GFP selectively mark the plus end of growing MT forming an EB1 comet. (ii) Comet detection identifies EB1-GFP-positive MT ends. (iii) MT growth subtracks are reconstructed using a single-particle-tracking algorithm, followed by linkage of detected comets with a high probability for correspondence between consecutive frames. Velocity, lifetime, and displacement of each MT growth subtrack are extracted. (C) Growth subtracks color coded by average frame-to-frame velocity for a small population of control (i) and CLASP dsRNA-treated (ii) cells. CLASP knockdown results in higher average growth subtrack velocities compared to that for the control. Bars = 10 μm.

