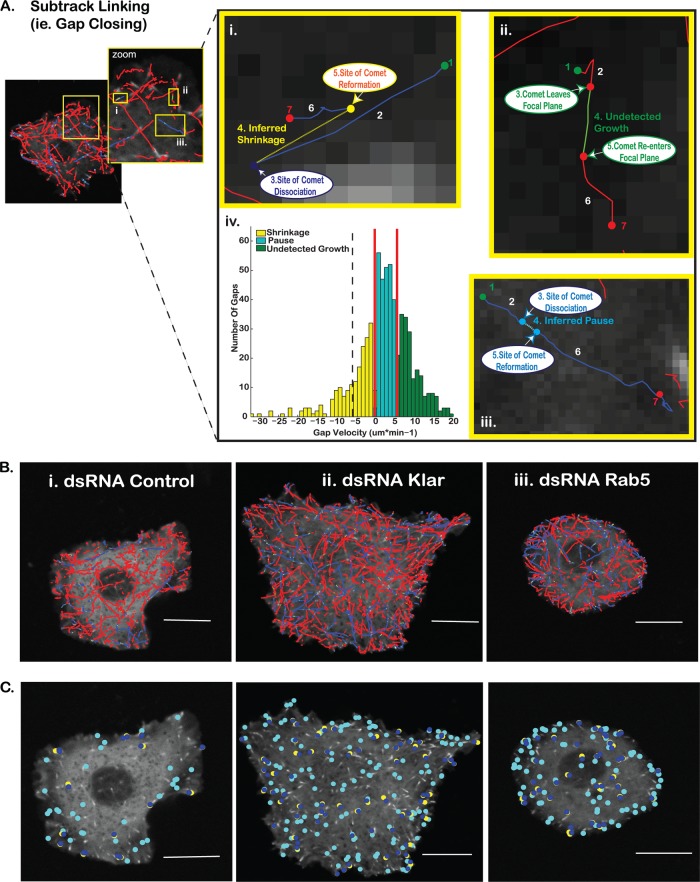
Fig 4.
Classification of subtrack linkage as a shrinkage, pause, or out-of-focus growth event. (A) Compound tracks that represent dynamic MT trajectories exhibiting at least one nonterminal pause or shrinkage event (i.e., a pause or shrinkage event followed by robust EB1 comet-decorated regrowth) are generated by linking growth subtracks that meet spatial and temporal criteria consistent with a linear microtubule trajectory. Gaps in detected EB1 growth trajectories correspond to MT shrinkages (yellow) (i), undetected growth events (green) (ii), or MT pauses (cyan) (iii). Along each trajectory, initiation sites for each comet-decorated growth events are detected (i to iii, step 1). EB1 comet detections are linked between subsequent frames, creating the initial MT growth subtrack (i to iii, step 2). Comet disappearance marks the beginning of each gap (i to iii, step 3), and the beginning of the next growth subtrack is marked by the reappearance of EB1-GFP (i to iii, step 5). Gaps between subtracks likely belonging to the same MT are linked (i to iii, step 4) and subsequently classified on the basis of the magnitude and direction of the gap velocity (the distance between the comet disappearance and comet reappearance sites divided by time between these comet detections) relative to the growth direction of the originally detected microtubule growth subtrack. MT growth resumes (i to iii, step 6) until another dynamic event occurs or the MT trajectory is terminally lost from the field of view due to either terminal catastrophe or the permanent loss of the microtubule from the focal plane (i to iii, step 7). (iv) Gap classification was determined by thresholding the gap velocity distributions for all control cells of the same experimental day. Faster, positive gap velocities likely correspond to undetected growth events, while slower gap velocities are likely MT pause events. Gaps with negative velocities are classified as shrinkage events. Red lines indicate the upper and lower thresholds used to delineate the three gap populations in this study. The black dashed line indicates the velocity threshold for the backward gap to pause reclassification, assuming symmetry of the gap velocity distribution around 0. (B) Overlays of the MT tracking corresponding to control (i), Klar dsRNA-treated (ii), and Rab5 dsRNA-treated (iii) cells. Blue solid lines, linked growth subtracks (compound MT tracks); red solid lines, unlinked growth subtracks (trajectories with no dissociation/reassociation of EB1-GFP); dashed yellow lines, inferred shrinkage events (backward gaps); dashed cyan lines, inferred pauses (low-velocity forward gaps); green solid lines, higher-velocity forward gaps (reclassified as out-of-focus EB1-decorated MT growth events.) (C) Individual pause and shrinkage events in control (i), Klar dsRNA-treated (ii), and Rab5 dsRNA-treated (iii) cells. Cyan, pause initiation sites; dark blue, shrinkage initiation sites; yellow, sites of shrinkage rescue events. Bars = 10 μm.

