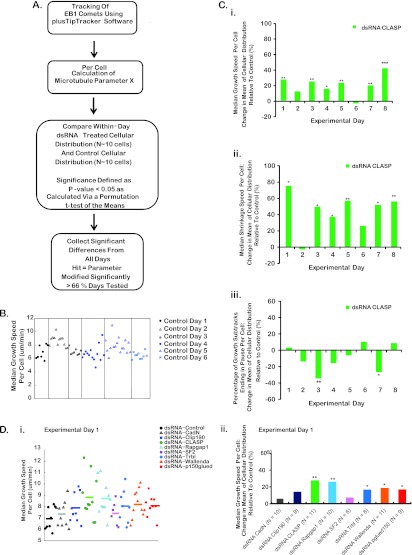
Fig 5.
Criteria used to define screen hits and example results for select experimental days, quantified parameters, and dsRNA treatments. (A) Outline of the approach used to identify strong modulators of MT dynamics. (B and C) Scatter plots (B) and bar graphs (C) of median growth speed. Data were plotted for each cell imaged for a sample experimental day. (B) Median growth speed for control dsRNA-treated Drosophila S2R+ cells across six arbitrary experimental days. (C) Percent difference in the mean of the cellular distribution relative to the control for CLASP dsRNA-treated cells. Data are plotted for a subset of measured parameters of MT dynamic instability: median growth speed per cell (i), median shrinkage speed per cell (ii), and percentage of growth subtracks terminating in a pause event per cell (iii). Each bar represents the percent difference in the mean of the cellular distribution relative to the control for a given experimental day. All P values were calculated using a one-tailed permutation t test of the means. *, P < 0.05; **, P < 0.01; ***, P < 0.001. (D) (i) Scatter plot of median growth speeds per cell on a given experimental day showing the cell-to-cell variability of control and experimental dsRNA-treated cells. Different colors indicate the different dsRNA treatments. Lines indicate the mean of the cellular distribution for a given treatment. (ii) Percent difference in the mean of the cellular distribution of a dsRNA treatment relative to the control population for those cellular distributions plotted in panel B.

