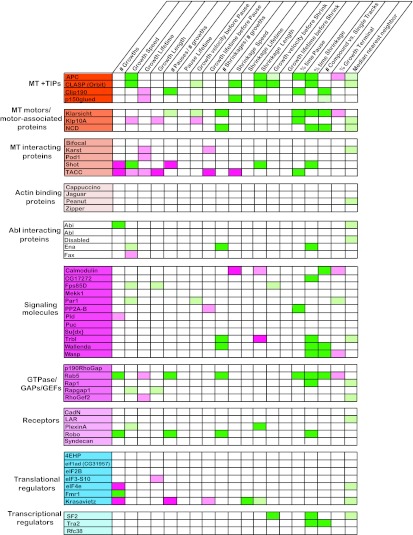
Fig 6.
Quantitative analysis of MT dynamics using plusTipTracker. Quantitative analysis was performed on 19 different parameters of MT dynamics in S2R+ cells treated with 48 individual dsRNAs targeting CLASP-interacting proteins. All values were compared to those for control dsRNA-treated cells per experimental day, and the data shown represent the population averages across at least three separate experimental days. Column headings define the individual parameters measured, while row headings identify the dsRNA tested. Dark green, increases compared to control of 25% or greater; dark pink, decreases compared to control of 25% or greater; light green and pink, increases and decreases compared to control of 25% or less, respectively. All data shown represent changes compared to control that are statistically significant. Statistical significance is defined as a P value of <0.05.

