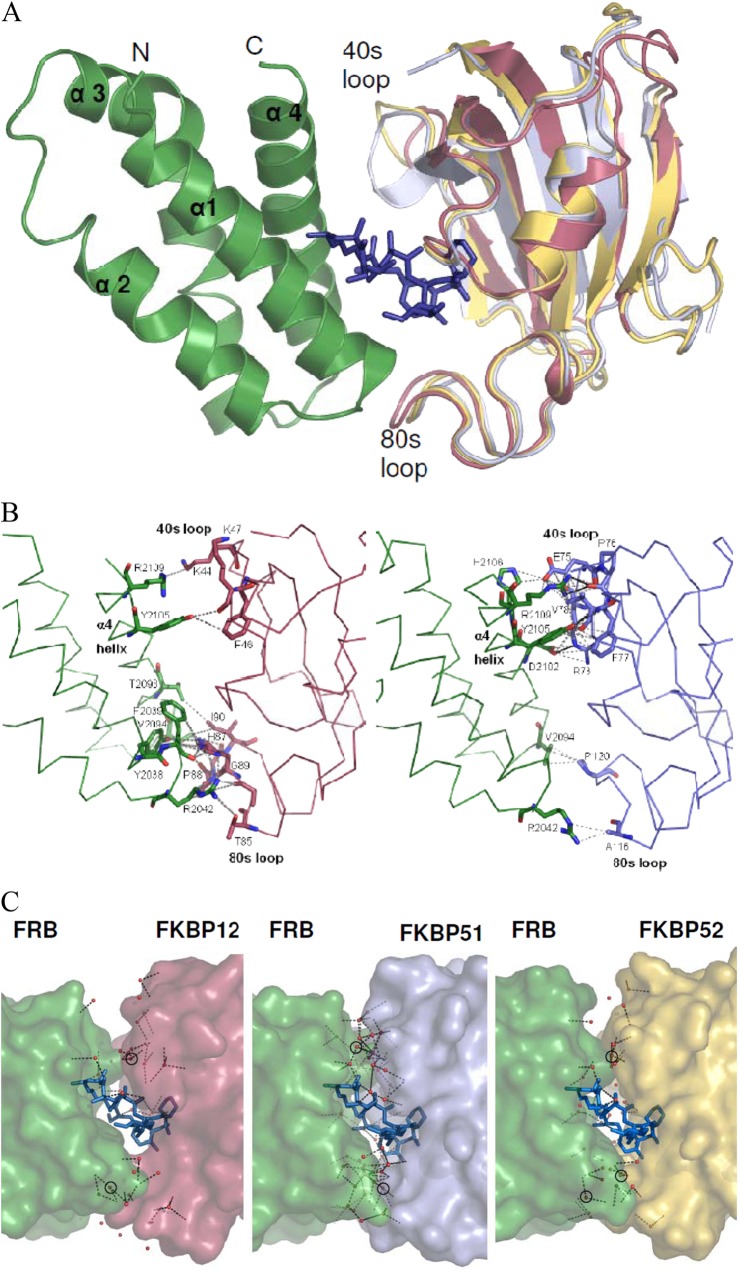
Fig 2.
Crystal structures of the complexes of FKBP51 and FKBP52 with rapamycin and mTOR. (A) Ribbon representation of the ternary minimal complexes of FKBP12 (2FAP) and of the FK1 domains (aa 1 to 143) of FKBP51 and FKBP52 with rapamycin and the FRB domain of mTOR. The FKBP domains were superimposed and are in red (FKBP12), pale blue (FKBP51 FK1), and yellow (FKBP52 FK1), respectively. The 40s and 80s loops, which directly contact the FRB domain, are indicated. For clarity, only a single rapamycin molecule (dark blue sticks) and a single FRB domain (green ribbon) are shown. (B) Direct protein-protein contacts in the ternary complexes of FKBP12 (left) and FKBP51 (right). The orientation is the same as in panel A. Interacting residues are shown as sticks. van der Waals interactions are gray dashed lines, and hydrogen bonds are black lines. FRB domains and FKBPs are shown as backbone traces. (C) Network of ordered water molecules at the FKBP-FRB domain interface. The proteins are shown as surface representations, and the water molecules are shown as red spheres. Hydrogen bonds are indicated by dashed lines. Water molecules that directly mediate interactions between the FRB domain and FKBPs are circled.

