Fig 3.
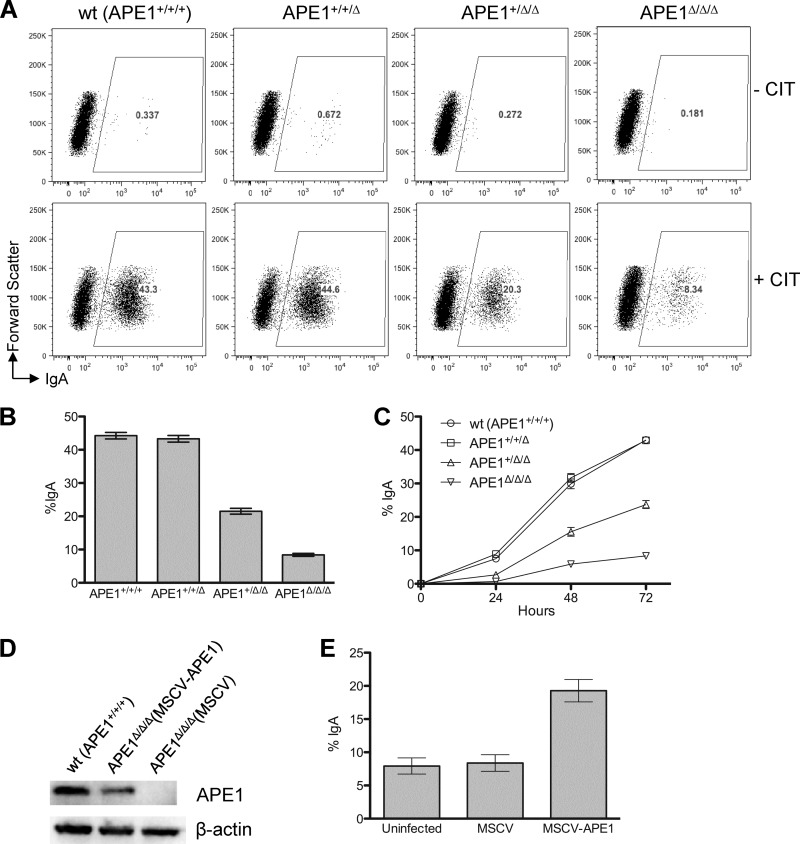
APE1 affects CSR efficiency. (A) Fluorescence-activated cell sorter (FACS) analysis of CSR by cell surface staining of IgA after 3 days of cell growth with (+CIT) or without (−CIT) cytokines. CIT, anti-CD40, interleukin-4, and TGF-β1; wt, wild type. (B) CSR efficiency (determined as the percentage of IgA+ cells) in CH12F3 cells containing 0 to 3 copies of APE1. Error bars indicate standard errors of 10 independent experiments. (C) APE1 affects CSR kinetics. CSR was monitored every 24 h over a span of 3 days. (D) Genetic complementation of APE1-null cells. Western blot analysis of transgenic APE1 expression in retrovirus-transduced APE1-null cells. (E) CSR in retrovirus-transduced APE1-null cells.

