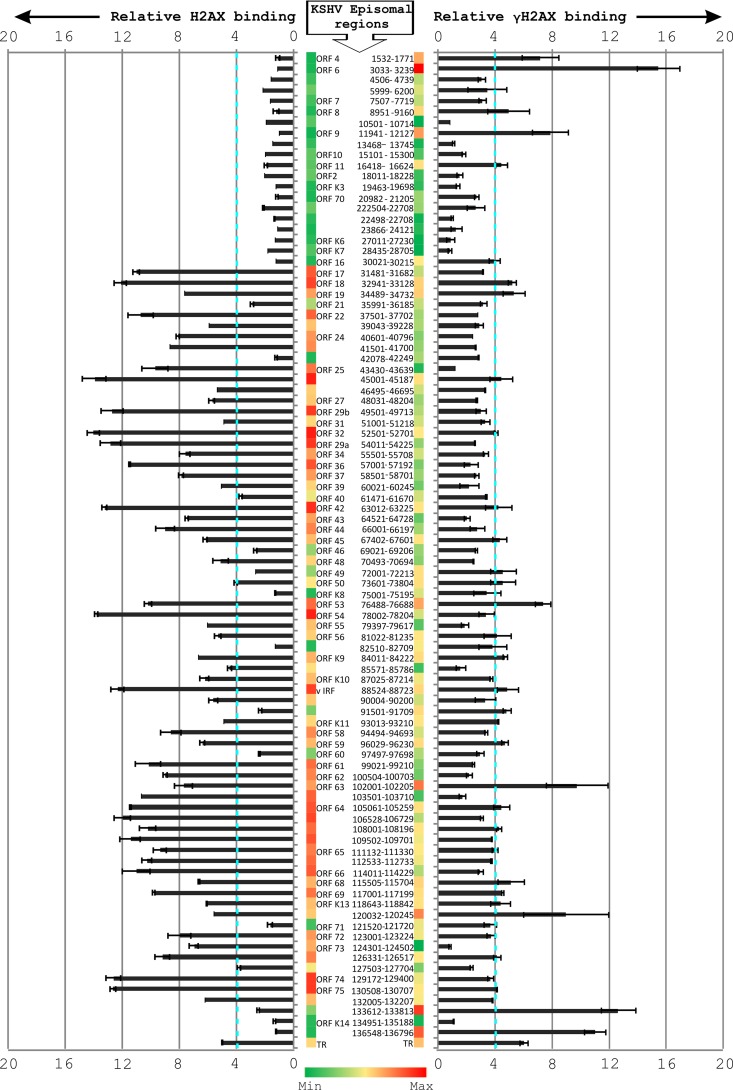
Fig 4.
Relative abundance of H2AX and γH2AX along the KSHV episome. In BCBL1 cells, ChIP assay was carried out using specific antibodies against γH2AX and H2AX. The KSHV episome was examined at a resolution of approximately 1.6 kb to evaluate the binding of H2AX and γH2AX. Relative amplification was calculated by subtracting the amplification with control antibodies.

