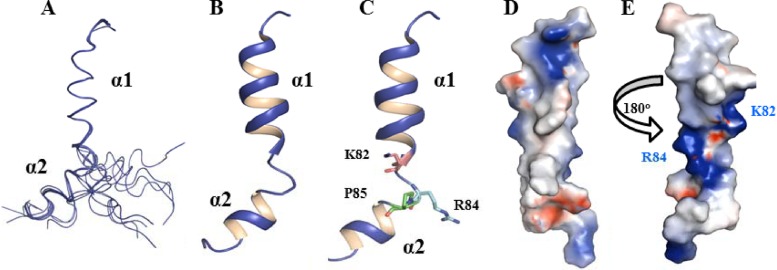
Fig 6.
Structures of NS2A pTMS3. (A) Stereo view of the ensemble of 15 NMR structures from CYANA. Only the Cα trace is shown with PyMOL. (B) Cartoon representation of the pTMS3 structure. Two α-helices are shown with labels. (C) Positions of K82, R84, and P85 in pTMS3. In the cartoon representation, the side chains of K82, R84, and P85 are shown in stick mode. (D) Surface representation of pTMS3. The charge analysis was conducted in Pymol. The positively charged residues, negatively charged residues, and hydrophobic residues are shown in blue, red, and white, respectively. (E) Surface representation of pTMS3 with a 180° rotation from panel D. All images were prepared using Pymol (www.pymol.org).

