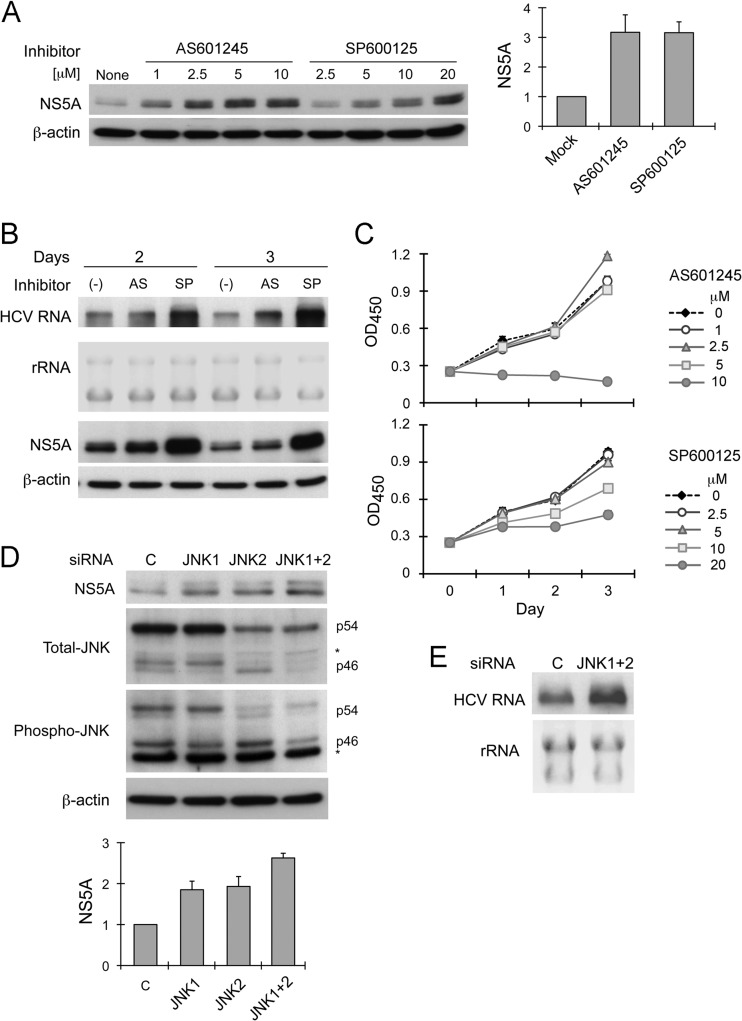
Fig 1.
JNK inhibition enhances HCV RNA abundance in replicon cells. (A) Effect of JNK inhibitors AS601245 and SP600125 on HCV replicon abundance. RG cells were treated with AS601245 (1 to 10 μM) or SP600125 (2.5 to 20 μM) for 24 h prior to harvesting and immunoblot assay for NS5A expression. (Left) Immunoblots of NS5A and β-actin, a loading control. (Right) Mean relative NS5A abundance ± standard deviations (SD) at 2.5 μM AS601245 or 10 μM SP600125 in 3 independent experiments. Protein abundance was quantified by densitometry and calculated as the amount relative to that in lysates of untreated cells (considered 1). (B) Northern blot analysis showing abundance of HCV replicon RNA in RG cells treated with 2.5 μM AS601245 (AS) or 10 μM SP600125 (SP) for 2 or 3 days. 18S and 28S ribosomal RNAs are shown as a loading control. At the bottom are immunoblots of NS5A and β-actin in cell lysates. (C) Impact of AS601245 (0 to 10 μM) or SP600125 (0 to 20 μM) on cellular proliferation. WST-1 assay was carried out on cells incubated for 1, 2, or 3 days in media containing inhibitors. Mean values at an optical density of 540 nm (OD450) were calculated from triplicate experiments. (D) RNAi knockdown of JNK1 and JNK2 enhances replicon RNA abundance. RG cells were transfected with JNK1-specific, JNK2-specific, a combination of JNK1- and JNK2-specific siRNAs (JNK1+2), or negative-control siRNAs 3 days prior to being harvested for immunoblotting. (Upper) Immunoblots of NS5A, total JNK, phosphorylated JNK, and β-actin. (Lower) Relative NS5A abundance (means ± SD) in 3 independent transfection experiments. Protein bands were quantified as described for panel A; an asterisk signifies a nonspecific protein band. (E) Northern blot showing replicon RNA abundance in RG cells transfected 3 days previously with JNK1- and JNK2-specific or control siRNAs.

