
Fig 1.
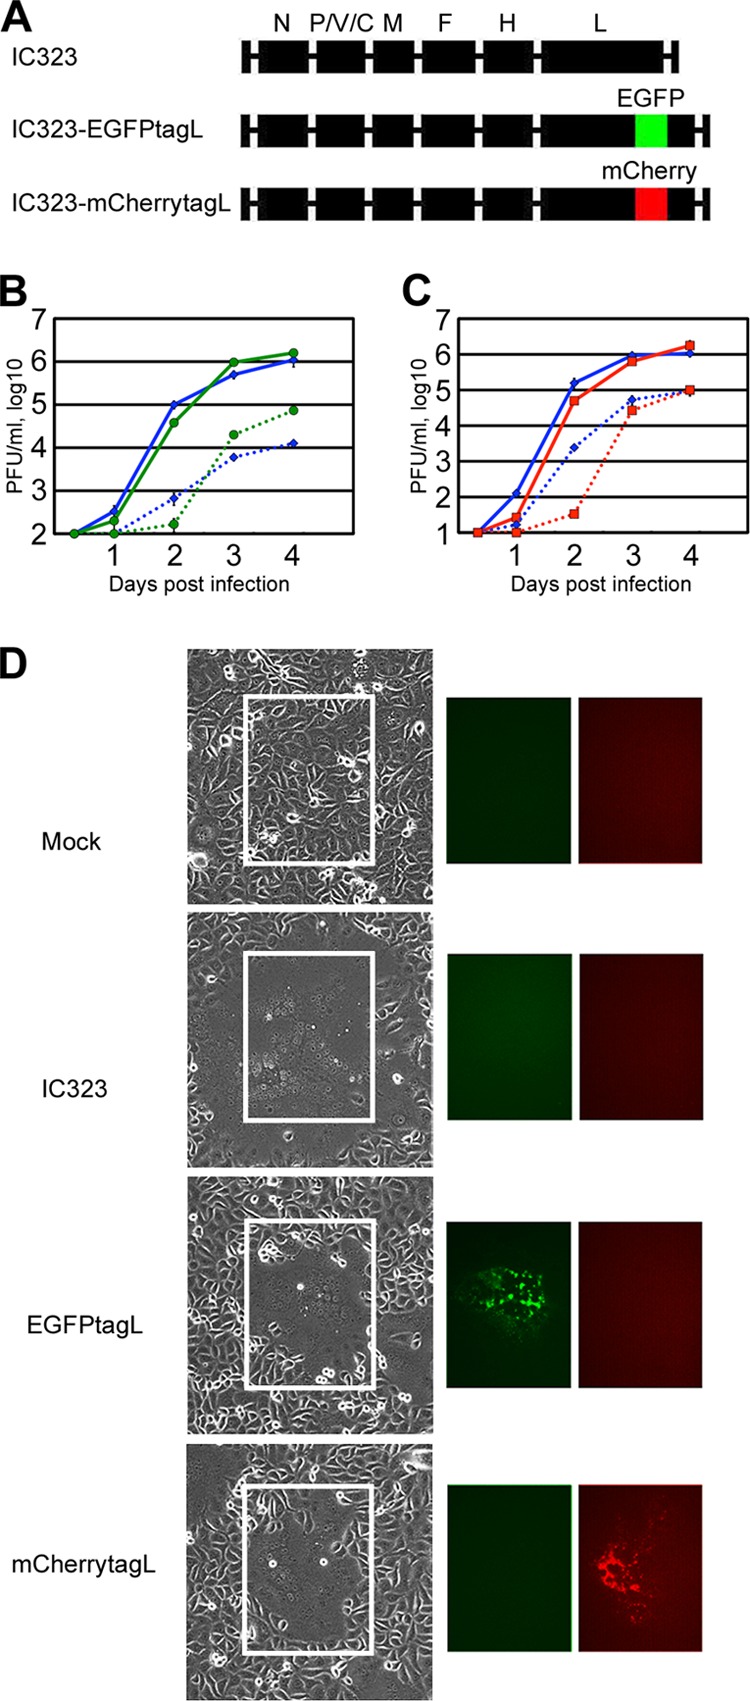
Construction of rMVs expressing FLP-tagged L proteins. (A) Genome structures of the rMVs. The six internal boxes indicate the N, P, M, F, H, and L genes of MV. The portions colored in green and red indicate the coding regions of the green FLP (EGFP) and red FLP (mCherry), respectively. (B and C) Growth kinetics of the rMVs in Vero/hSLAM cells. Vero/hSLAM cells were infected with the rMVs at an MOI of 0.01. At various time points, the cells and culture medium were harvested separately, and the PFU in both samples were determined. The data represent the means ± standard deviations of results from triplicate samples. The solid and dashed lines indicate the data for the cell-associated and cell-free titers, respectively. (B) Blue and green symbols indicate the data for IC323 and IC323-EGFPtagL, respectively. (C) Blue and red symbols indicate the data for IC323 and IC323-mCherrytagL, respectively. (D) Syncytium morphology and FLP-tagged L protein expression in rMV-infected Vero/hSLAM cells. Vero/hSLAM cells were infected with the rMVs at an MOI of 0.01. The cells were observed daily under light and fluorescence microscopes. Data at 2 days p.i. are shown.