
Fig 4.
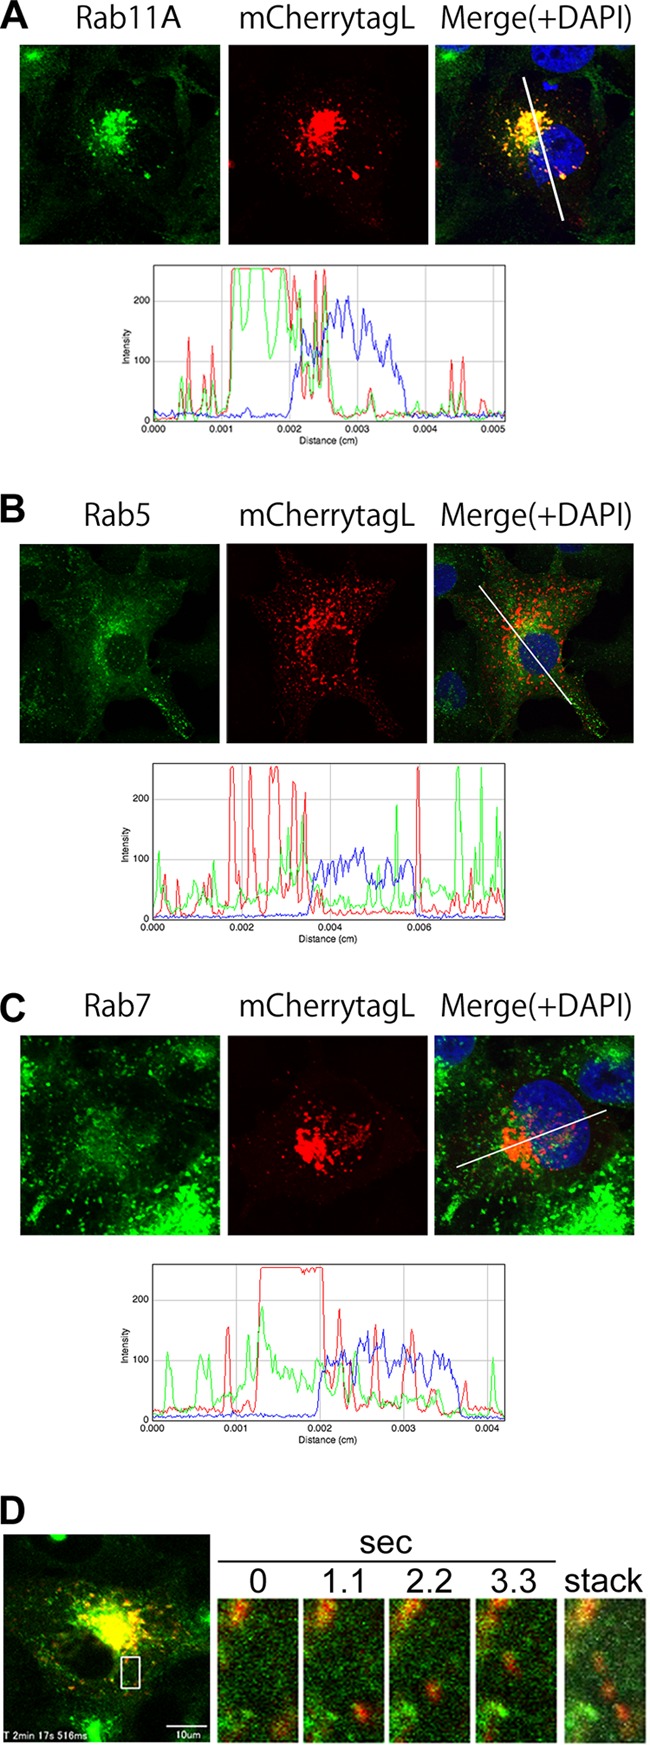
Colocalization and cotransport of mCherry-tagged L protein with EGFP-tagged Rab11A protein. (A–C) Vero/hSLAM cells constitutively expressing EGFP-Rab11A (A), -Rab5 (B), or -Rab7 (C) (Vero/hSLAM/EGFP-Rab cells) were infected with IC323-mCherrytagL. At 2 days p.i., the cells were fixed and analyzed by confocal microscopy. Green and red fluorescence indicates the EGFP-tagged Rab proteins and mCherrytagL protein, respectively. Nuclei were counterstained with DAPI (blue). The lower panels show the RGB line profiles along the selected lines in the merged images (upper right panels). (D) Vero/hSLAM/EGFP-Rab11A cells were infected with IC323-mCherrytagL. At 2 days p.i., the intracellular movements of EGFP-Rab11A and mCherrytagL were analyzed by time-lapse fluorescence microscopy. The left panel shows the overall confocal image of the cells at the start of the time-lapse analysis. Green and red fluorescence indicates the EGFP-Rab11A and mCherrytagL proteins, respectively. The right panels show enlarged time-lapse images of the area indicated by the box in the left panel. A representative series of images taken at 1.1-s intervals and a time-stacked image are shown. The movement of the mCherrytagL dots with EGFP-Rab11A is indicated by the white arrow in the time-stacked image.