Fig 5.
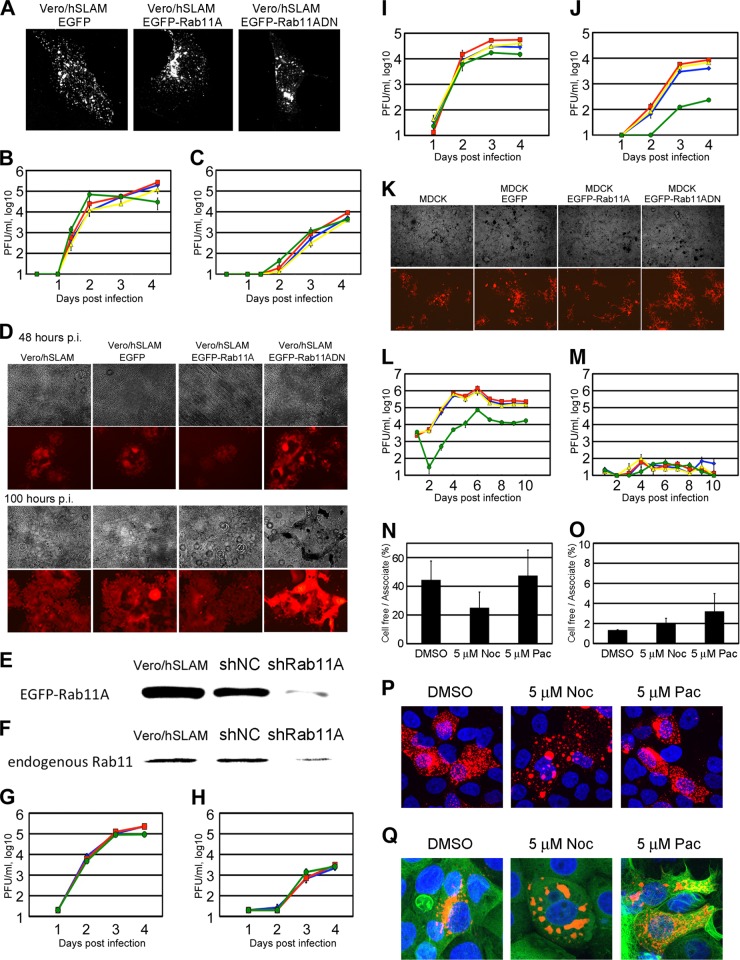
Growth kinetics of the IC323-AddmCherry virus in Rab11ADN-expressing Vero/hSLAM or MDCK cells. (A) Vero/hSLAM cells constitutively expressing EGFP, EGFP-Rab11A, or EGFP-Rab11ADN were infected with IC323, cultured for 1 day, and analyzed by immunofluorescence and confocal microscopy. The N protein was detected by indirect immunofluorescence assay. (B to D) Vero/hSLAM cells constitutively expressing EGFP, EGFP-Rab11A, or EGFP-Rab11ADN were infected with IC323-AddmCherry at an MOI of 0.01. At various time points, the cells and culture medium were harvested separately, and the PFU in both samples were determined. The data for the cell-associated and cell-free titers are plotted in panels B and C, respectively. The data represent the means ± standard deviations of results from triplicate samples. The blue, red, yellow, and green lines indicate the data for Vero/hSLAM, Vero/hSLAM/EGFP, Vero/hSLAM/EGFP-Rab11A, and Vero/hSLAM/EGFP-Rab11ADN, respectively. In panel D, representative CPEs at 48 and 100 h p.i. are shown. Red fluorescence indicates the virus-derived mCherry expression. (E) Vero/hSLAM cells constitutively expressing negative-control shRNA (shNC) or shRNA against Rab11A mRNA (shRab11A) were transfected with pMXsIP-EGFP-Rab11A. At 2 days posttransfection, EGFP-Rab11A expression levels were analyzed by Western blotting. (F) Vero/hSLAM cells constitutively expressing shNC or shRab11A were lysed and endogenous Rab11 expression was analyzed by Western blotting. (G and H) Vero/hSLAM cells constitutively expressing shNC or shRab11A were infected with IC323-AddmCherry at an MOI of 0.01. At various time points, PFU in cells (G) and culture medium (H) were determined. The data represent the means ± standard deviations of results from triplicate samples. The blue, red, and green lines indicate the data for Vero/hSLAM, Vero/hSLAM/shNC, and Vero/hSLAM/shRab11A, respectively. (I to K) MDCK cells constitutively expressing EGFP, EGFP-Rab11A, or EGFP-Rab11ADN were plated on 24-well plates and immediately infected with IC323-AddmCherry at an MOI of 0.2. At various time points, the cells and culture medium were harvested separately, and the PFU in both samples were determined. The data for the cell-associated and cell-free titer are plotted in panels I and J, respectively. The data represent the means ± standard deviations of results from triplicate samples. The blue, red, yellow, and green lines indicate the data for MDCK, MDCK/EGFP, MDCK/EGFP-Rab11A, and MDCK/EGFP-Rab11ADN, respectively. In panel K, representative CPEs at 4 days p.i. are shown. Red fluorescence indicates the virus-derived mCherry expression. (L and M) MDCK cells constitutively expressing EGFP, EGFP-Rab11A, or EGFP-Rab11ADN were seeded on transwell filters with 0.4-μm pores and immediately infected with IC323-AddmCherry at an MOI of 0.2. At various time points, the apical and basolateral media were harvested separately, and the PFU in both samples were determined. The data for the apical and basolateral titers are plotted in panels L and M, respectively. The data represent the means ± standard deviations of results from triplicate samples. The blue, red, yellow, and green lines indicate the data for MDCK, MDCK/EGFP, MDCK/EGFP-Rab11A, and MDCK/EGFP-Rab11ADN, respectively. (N and O) MDCK (N) and Vero/hSLAM (O) cells were infected with IC323-AddmCherry at MOIs of 0.2 and 0.01, respectively. At 4 and 2 days p.i., MDCK cells and Vero cells, respectively, were treated with reagents (5 μM nocodazole [5 μM Noc], 5 μM paclitaxel [5 μM Pac], or dimethyl sulfoxide [DMSO] [as vehicle control]) for 1 day. PFU counts in cells and culture medium were determined. The ratios of cell-free virus titer to cell-associated virus titer are plotted. The data represent the means ± standard deviations of results from triplicate samples. (P and Q) MDCK (P) and Vero/hSLAM (Q) cells, which were transfected with pAcGFP1-Tubulin, were infected with IC323-mCherrytagL at MOIs of 0.2 and 0.1, respectively. At 4 and 2 days p.i., MDCK cells and Vero/hSLAM cells, respectively, were treated with reagents for 1 day. Then, cells were fixed and nuclei were stained with DAPI (blue). Z-stacks of images were acquired by confocal microscopy. Green (Q) and red (P and Q) fluorescence indicates the AcGFP-tagged α-tubulin and mCherrytagL protein, respectively. The Z-projection images of the maximum intensities are shown.

