
Fig 6.
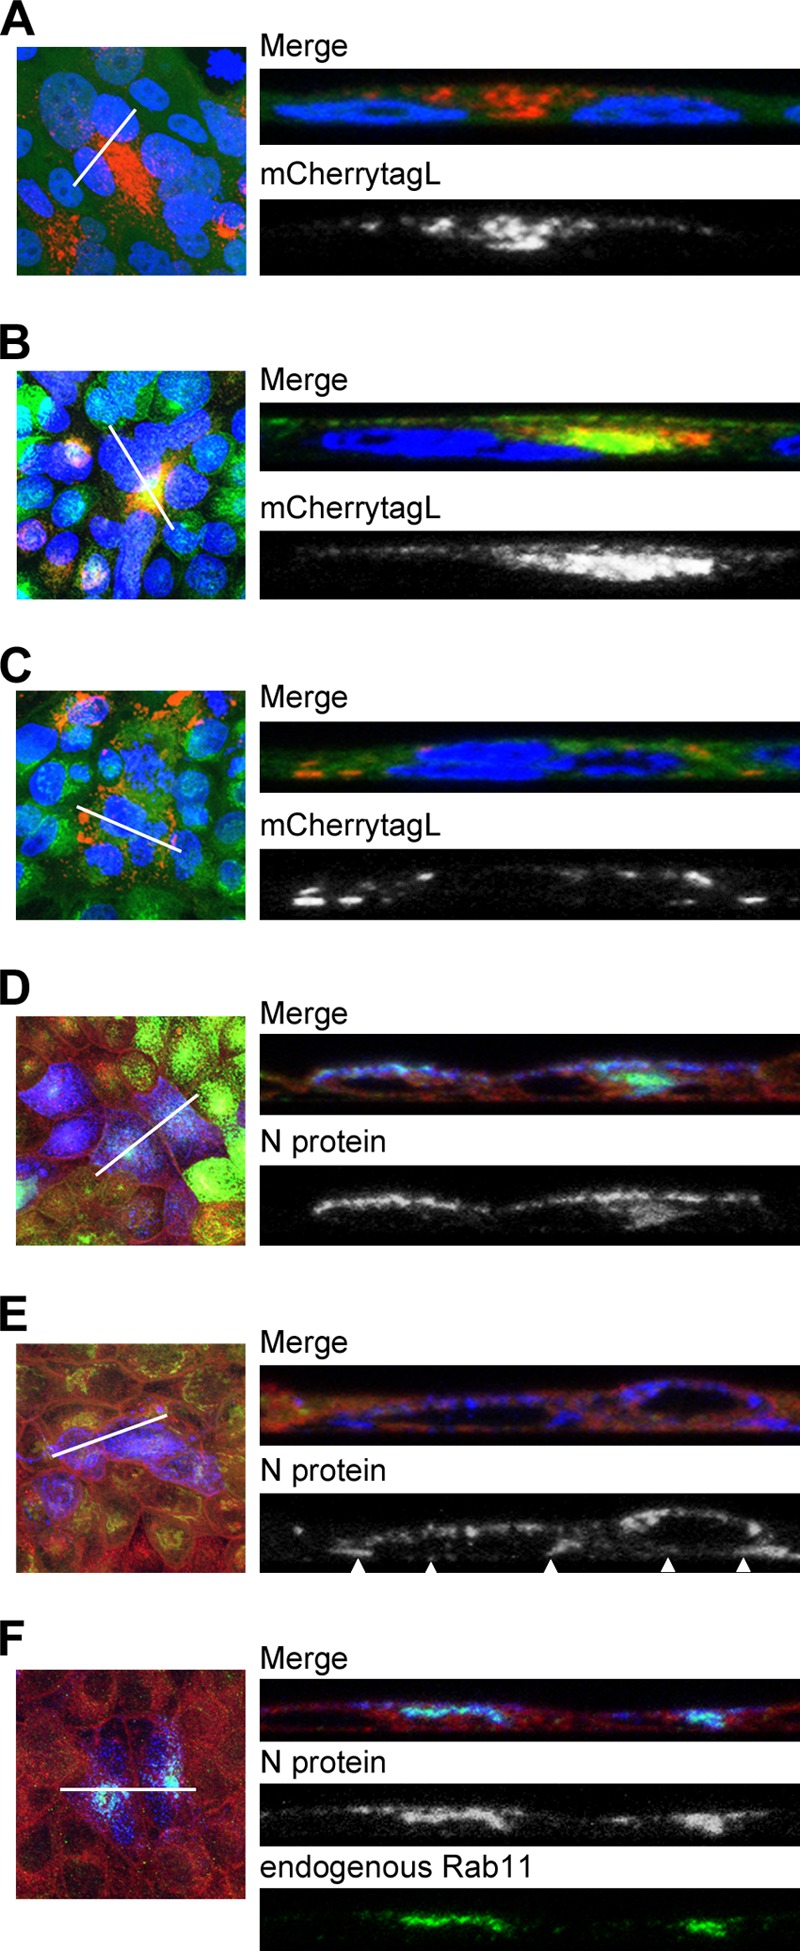
Intracellular localizations of the MV RNP complex and Rab11 in MDCK cells. (A to C) MDCK/EGFP (A), MDCK/EGFP-Rab11A (B), and MDCK/EGFP-Rab11ADN (C) cells were infected with IC323-mCherrytagL at an MOI of 0.2. At 4 days p.i., the cells were fixed and their nuclei were stained with DAPI (blue). Z-stacks of images were acquired by confocal microscopy. Green and red fluorescence in the merged images indicates the EGFP-tagged proteins and mCherrytagL protein, respectively. The left panels show Z-projection images of the maximum intensities, and the right panels show reconstituted images of the XZ plane along the lines in the left panels. (D and E) MDCK/EGFP-Rab11A (D) and MDCK/EGFP-Rab11ADN (E) cells were infected with IC323 at an MOI of 0.2. At 4 days p.i., the cell membrane was stained with CM-Dil (red in the merged images) and the cells were fixed for analyses by immunofluorescence and confocal microscopy. Green fluorescence in the merged images indicates the EGFP-tagged proteins. The N protein was detected with a specific primary antibody and an Alexa Fluor 405-conjugated secondary antibody (blue in the merged images). The left and right panels show Z-projection images and reconstituted images of the XZ plane, respectively, as shown in panels A to C. Arrowheads in panel E indicate the accumulation of the N proteins at the bottom of the cytoplasm. (F) MDCK cells were infected with IC323 at an MOI of 0.2. At 4 days p.i., the cell membrane was stained with CM-Dil (red in the merged images) and the cells were fixed for analyses by immunofluorescence and confocal microscopy. The N protein and endogenous Rab11 were detected with specific primary antibodies and secondary antibodies conjugated with Alexa Fluor 405 (blue in the merged images) and Alexa Fluor 488 (green), respectively. The left and right panels show Z-projection images and reconstituted images of the XZ plane, respectively, as shown in panels A to C.