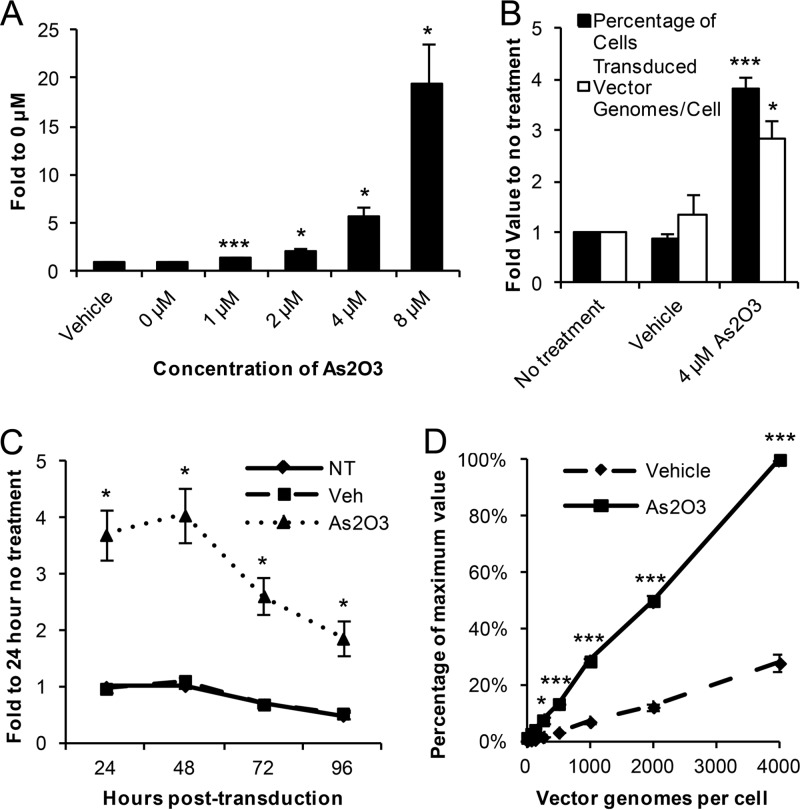
Fig 1.
HEK-293 cells transduced by rAAV2 after As2O3 treatment. HEK-293 cells were treated overnight with As2O3 or a vehicle control and then transduced with rAAV2-CBA-EGFP. (A) Cells were treated with the indicated dose of As2O3 and transduced with 500 vg/cell rAAV2. The percentage of cells transduced at 48 h posttransduction is shown as the fold increase compared to the level for the no-treatment group. (B) The numbers of vector genome copies per cell present and percentages of cells transduced were assayed at 48 h posttransduction following the indicated treatment and transduction with 500 vg/cell. Values are indicated as fold increase compared to results for the no-treatment group. (C) Cells were treated and transduced as described for panel B, harvested at the indicated time points, and assayed for the percentage of cells transduced. Values are indicated as fold increase compared to the no-treatment group at 24 h. NT, no treatment; Veh, vehicle. (D) After treatment as described for panel B, cells were transduced with the indicated doses of rAAV2, and the percentage of cells transduced was assayed 48 h posttransduction. Values represent the percentage of the maximum value reached in each experiment. Data shown are the means from at least 3 independent experiments; error bars represent the standard errors of the means (SEM). P < 0.05 (*) and P < 0.005 (***) based on comparisons of sample means by the Student t test.

