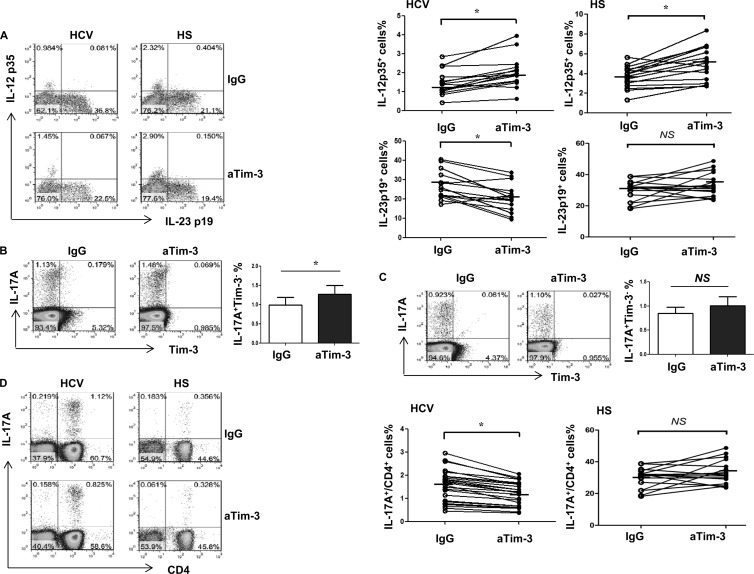
Fig 3.
Tim-3 blockade in PBMCs from HCV-infected individuals improves IL-12p35 and inhibits IL-23p19 productions by CD14+ monocytes, leading to a reduction of TH17 cells. (A) Purified CD14+ monocytes from HCV-infected individuals and HS were incubated with αTim-3 and control IgG antibody for 72 h and then stimulated with LPS/R848 for 6 h, followed by flow cytometric analysis of IL-12p35 and IL-23p19 expression. Representative dot plots and summary data measuring IL-12p35 and IL-23p19 production in CD14+ monocytes in HCV versus HS with the blockade of Tim-3 or IgG antibody are shown. Each symbol represents an individual subject, connected by a line meaning the same cells treated with IgG or aTim-3, the horizontal bars represent median values. *, P < 0.05; NS, no significance by paired t test. (B) Representative experiment of purified CD4+ T cells from an HCV-infected individual that were incubated with αTim-3 and IgG for 72 h, stimulated with PMA/ionomycin for 6 h, followed by flow cytometric analysis of IL-17 versus Tim-3 expression in CD4+ T cells. (C) Representative experiment of CD14+ monocyte-depleted PBMCs from an HCV-infected individual that were incubated with αTim-3 and IgG for 72 h and stimulated with PMA/ionomycin for 6 h, followed by flow cytometric analysis of IL-17 versus Tim-3 expression in CD4+ T cells. (D) PBMCs from HCV-infected individuals and HS were incubated with αTim-3 and control IgG antibody for 72 h and then stimulated with PMA/ionomycin for 6 h, followed by flow cytometric analysis of IL-17A expression in CD4+ T cells. Representative dot plots and summary data measuring IL-17 production in CD4+ T cells in HCV versus HS with the blockade of Tim-3 or IgG antibody are shown. Each symbol represents an individual subject, connected by a line meaning the same cells treated with IgG or aTim-3, the horizontal bars represent median values. *, P < 0.05; NS, no significance by paired t test.

