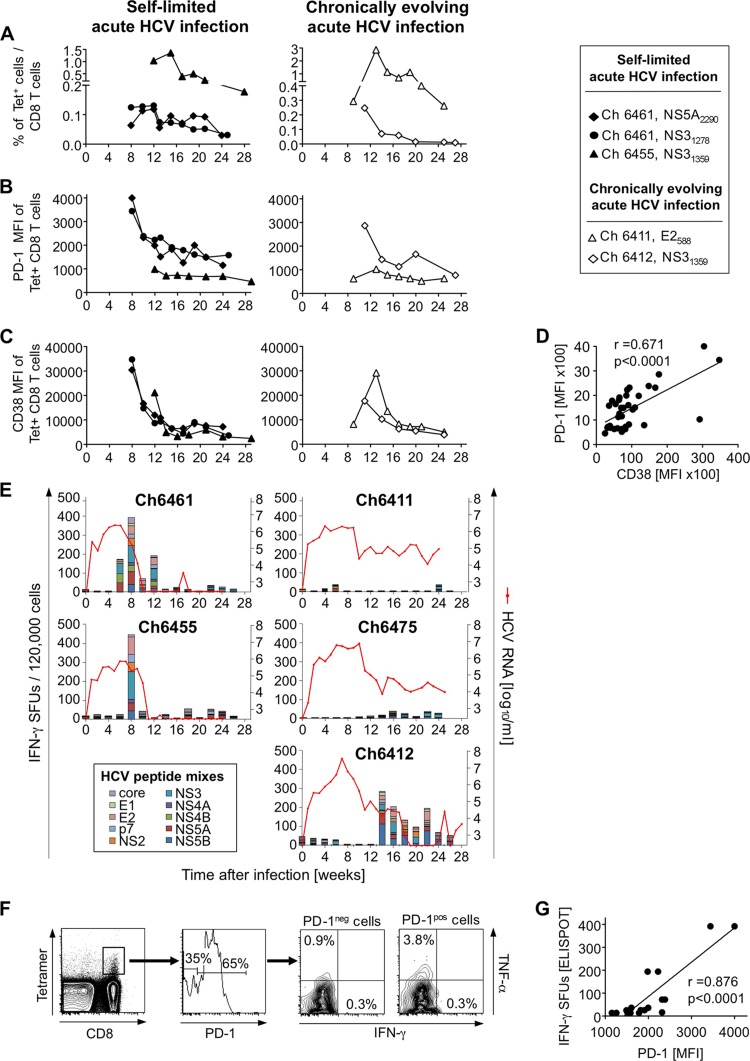
Fig 2.
Characterization of HCV-specific T-cell responses in acute HCV infection. (A) The frequency of HCV-specific T cells in the blood was evaluated with P. troglodytes class I tetramers. (B to D) The levels of PD-1 (B) and CD38 (C) expression (MFIs) and the correlation between the CD38 MFI and the PD-1 MFI (D) were determined on tetramer+ CD8+ T cells during the first 6 months of HCV infection using previously described techniques (25). r, correlation coefficient, linear regression analysis. (E) Ex vivo IFN-γ ELISpot assays were performed in duplicate by stimulating PBMCs with 18 mixes of overlapping HCV peptides (600 peptides total) spanning the entire HCV polyprotein sequence using a previously described technique (35). HCV RNA titers were previously reported (23, 24) and are shown as red lines for reference purposes. (F) PD-1+ and PD-1− subsets of NS31278-stimulated tetramer+ CD8+ T cells (Ch6461, week 9 after infection) were assessed for IFN-γ and TNF-α secretion using a previously described technique (25). (G) The overall T-cell IFN-γ response against overlapping peptides (IFN-γ ELISpot) was correlated with the PD-1 MFIs of tetramer+ CD8+ T cells at time points throughout the course of infection (Ch6461) in a linear regression analysis. SFU, spot-forming unit.

