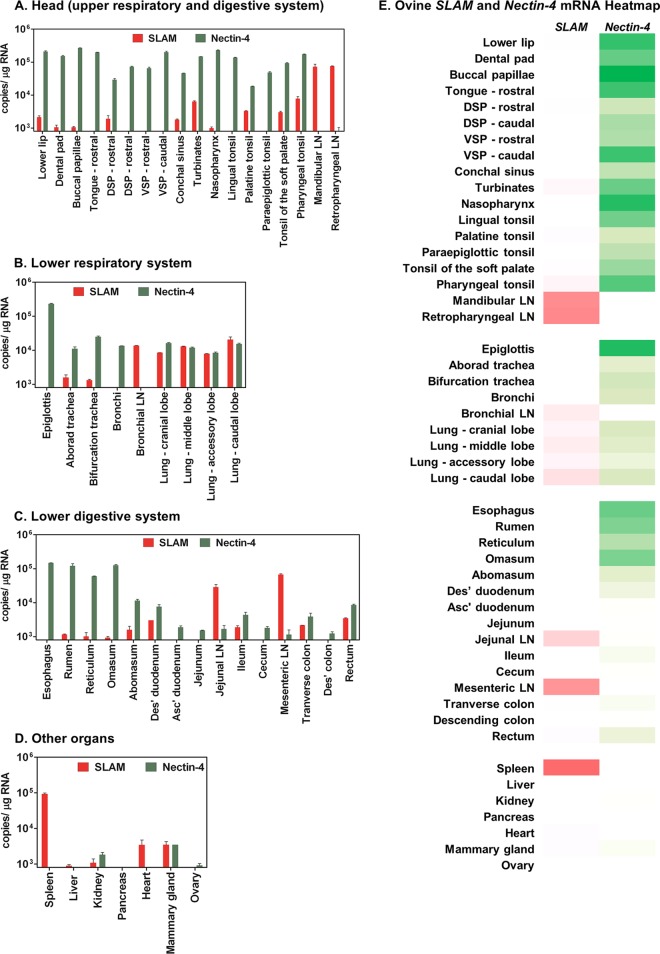
Fig 2.
Endogenous mRNA expression profile of ovine SLAM and Nectin-4 in various Ovis aries tissues. A total of 49 separate tissues were isolated from a 2-year-old ewe (Texel/North Country Mule cross). Total cell RNA was extracted from tissue, and 100 ng of this RNA was used to generate an oligo(dT)-primed cDNA library. mRNA copies of SLAM (red) and Nectin-4 (green) were calculated by duplicate TaqMan qPCR analysis of these cDNA libraries (using standard curve quantification). The detection limit of this qPCR was set at 10 copies. The data were normalized to copies/μg RNA and grouped anatomically, as follows: the head (upper respiratory and digestive system) (A), the lower respiratory system (B), the lower digestive system (C), and the other major organs (D). (E) Heat map of the mRNA data in panels A to D representing the relative levels of SLAM (red) and Nectin-4 (green) expression in the 49 tissues (darker shading indicates higher expression). Abbreviations: LN, lymph nodes; DSP, dorsal surface of the soft palate; VSP, ventral surface of the soft palate; Asc′, ascending; Des′, descending. This data set is representative of 3 individually performed RT-qPCR analyses.

