FIGURE 1.
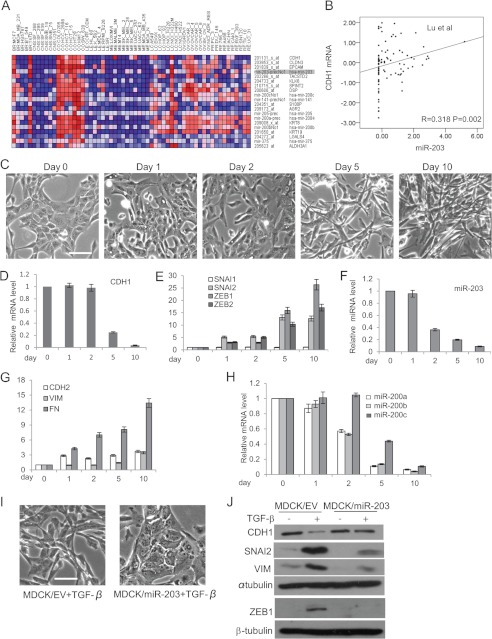
miR-203 in MDCK cells is repressed in TGF-β-induced EMT. A, heat map showing the top 20 candidate genes co-expressed with CDH1 in the NCI60 database. B, the co-expression of CDH1 mRNA and miR-203 in human tumor tissues. The Spearman correlation coefficients and significance levels are indicated. C, phase-contrast microscopy of MDCK cells treated with TGF-β for the indicated days. Scale bar, 50 μm. D, real time RT-PCR showing the CDH1 expression level in MDCK cells treated with TGF-β for the indicated days. E, TGF-β induced the expression of SNAI2, ZEB1, and ZEB2 in MDCK cells. F, TGF-β repressed miR-203 in MDCK cells as determined by TaqMan miRNA assays. G, TGF-β induced the expression of CDH2, VIM, and FN1 in MDCK cells as determined by real time RT-PCR. H, TGF-β repressed miR-200a, miR-200b, and miR-200c in MDCK cells. I, the restoration of miR-203 prevented the morphology change induced by TGF-β. Scale bar, 50 μm. J, the restoration of miR-203 prevented the up-regulation of SNAI2 and the down-regulation of CDH1 induced by TGF-β. Error bars represent S.D.

