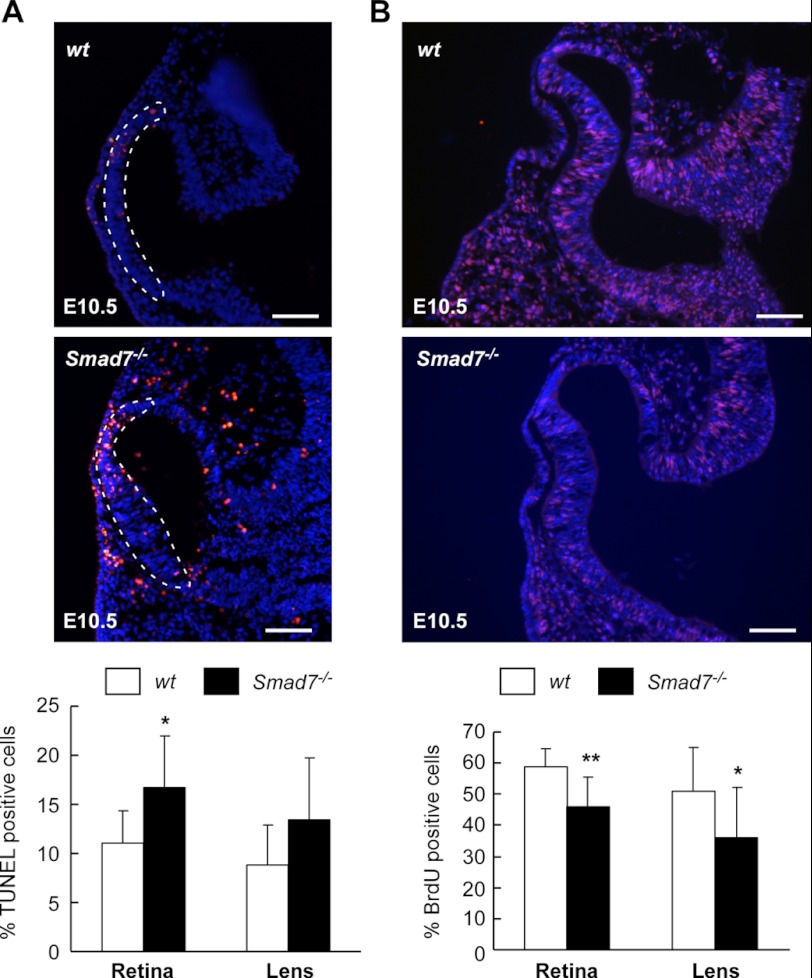
FIGURE 2.
Altered cell apoptosis and proliferation in Smad7 null mice. A, cell apoptosis in the retina and lens. Representative images of TUNEL assay are shown in the upper panel. The quantification of TUNEL-positive nuclei is shown in the lower panel as mean ± S.D. (n = 3 for control and 4 for Smad7 null embryos). The percentage was calculated as TUNEL-positive cells/total cells in both retina and lens. The single layer cells contacting the optic vesicle were used in counting the TUNEL-positive cells in the lens. The dashed outline indicates the retina cells. B, assessment of cell proliferation by the BrdU incorporation assay. Representative images are shown in the upper panel, and BrdU-positive cells are labeled in red. The quantitation of BrdU incorporation is shown in the lower panel as mean ± S.D. (n = 4 for control and 3 for Smad7 mutant embryos). The percentage was calculated as BrdU-positive cells/total cells in both retina and lens. The nuclei were stained with Hoechest 33342 (blue). * and ** represent p < 0.05 and p < 0.01, respectively, between the two groups of embryos. Scale bar: 50 μm.

