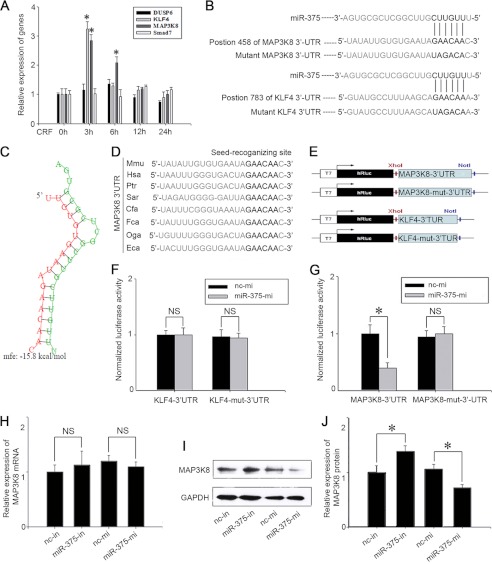
FIGURE 4.
miR-375 binds to MAP3K8 3′-UTR and down-regulates its protein level. A, the expression levels of Dusp6, KLF4, MAP3K8, and Smad7 in AtT-20 cells treated with 100 nm CRF. Data are presented as means ± S.E. (n = 3). *, p < 0.05 versus control (t test). B, the predicted miR-375 binding site is in the MAP3K8 3′-UTR and KLF4 3′-UTR. The data were taken from Sanger's miRNA target database. C, there is a schematic representation of the hybridization between miR-375 and MAP3K8 3′-UTR and theirs minimum free energy (mfe). Green and red letters indicate miR-375 and MAP3K8, respectively. D, the seed regions of miR-375 and the seed-recognizing sites in the MAP3K8 3′-UTR are indicated in boldface type, and all nucleotides in the seed-recognizing sites are completely conserved in several species. Mmu, M. musculus; Hsa, Homo sapiens; Ptr, Pan troglodytes; Sar, Sorex araneus; Cfa, Canis lupus familiaris; Fca, Felis catus; Oga, Otolemur garnettii; Eca, Equus caballus. E, schematic of inserted MAP3K8 3′-UTR and KLF-4 3′-UTR sequences. F and G, relative luminescence intensity detected by the ModulusTMII microplate multimode reader after miR-375-mi or nc mimic (nc-mi) and Dual-Luciferase vectors co-transfected into 293T cells. The data are means ± S.E. for multiple separate transfections (n = 4). *, p < 0.05. H, relative quantification of MAP3K8 mRNA levels. AtT-20 cells were transfected with nc inhibitor (nc-in), miR-375-in, nc mimic, miR-375-mi. The data are means ± S.E. for multiple separate transfections (n = 3). I, analysis of MAP3K8 protein. AtT-20 cells were transfected as shown above and protein extracts were analyzed by Western blotting. J, quantification of MAP3K8 protein levels. Results are means ± S.E. of three independent experiments; *, p < 0.05; NS, not significant (p > 0.05) versus cells transfected with nc inhibitor or nc mimic (t test). Data are presented as means ± S.E. (n = 3). *, p < 0.05.

