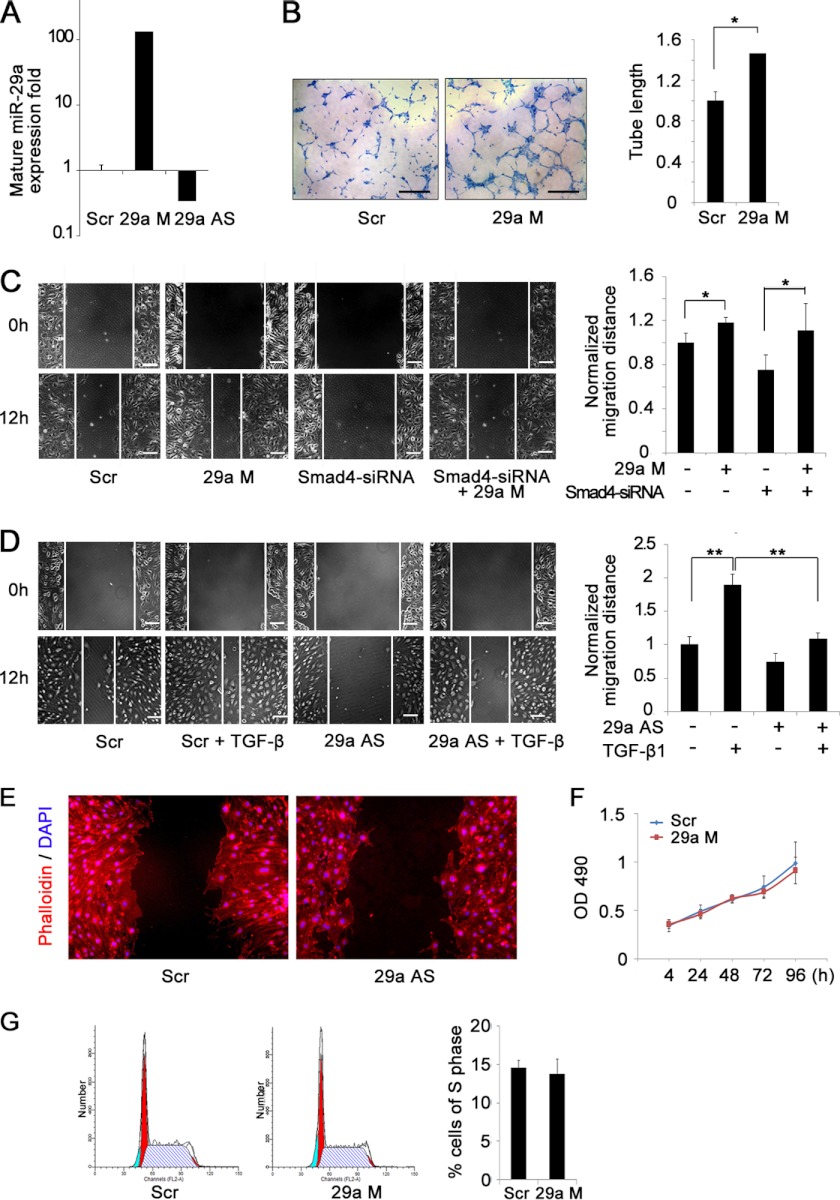
FIGURE 4.
MiR-29a promotes endothelial migration and tube formation. A, real-time PCR analysis confirmed miR-29a overexpression or down-regulation with mimic (29a M) or antisense oligo (29a AS) in bEnd.3 cells. Scr, scrambled. B, pretreatment with miR-29a mimic increased tube formation of bEnd.3 cells in Matrigel (left panel). Tube lengths of the formed tubes were quantitated (right panel). Scale bar = 0.5 mm. *, p < 0.05; **, p < 0.01. n = 3. C, overexpression of miR-29a rescued the impaired migration ability of Smad4-siRNA bEnd.3 cells in a wound healing assay. Cell migration to the wound surface was monitored from 0–12 h (left panel). The migrated distance of the wound edge was quantified (right panel). Scale bar = 100 μm. *, p < 0.05; **, p < 0.01. n = 6. D, the enhanced migration of bEnd.3 cells induced by 5 ng/ml TGF-β1 was dramatically blocked by miR-29a antisense oligonucleotides in a wound healing assay (left panel). The migrated distance of the wound edge was quantified (right panel). Scale bar = 100 μm. *, p < 0.05; **, p < 0.01. n = 6. E, miR-29a knockdown induced a decrease in cytoplasmic extensions into the denuded area in the scratch assay. The actin cytoskeletal structure was observed by phalloidin staining of control and miR-29a knockdown bEnd.3 cells. F, cell numbers were quantified by MTS assay at the indicated time points. MiR-29a overexpression had no effect on endothelial cell number at 4–96 h of plating. G, cell cycle distribution was assessed using flow cytometry. The percentage cells in S phase were quantified. MiR-29a transfection had no influence on endothelial cell cycle distribution.

