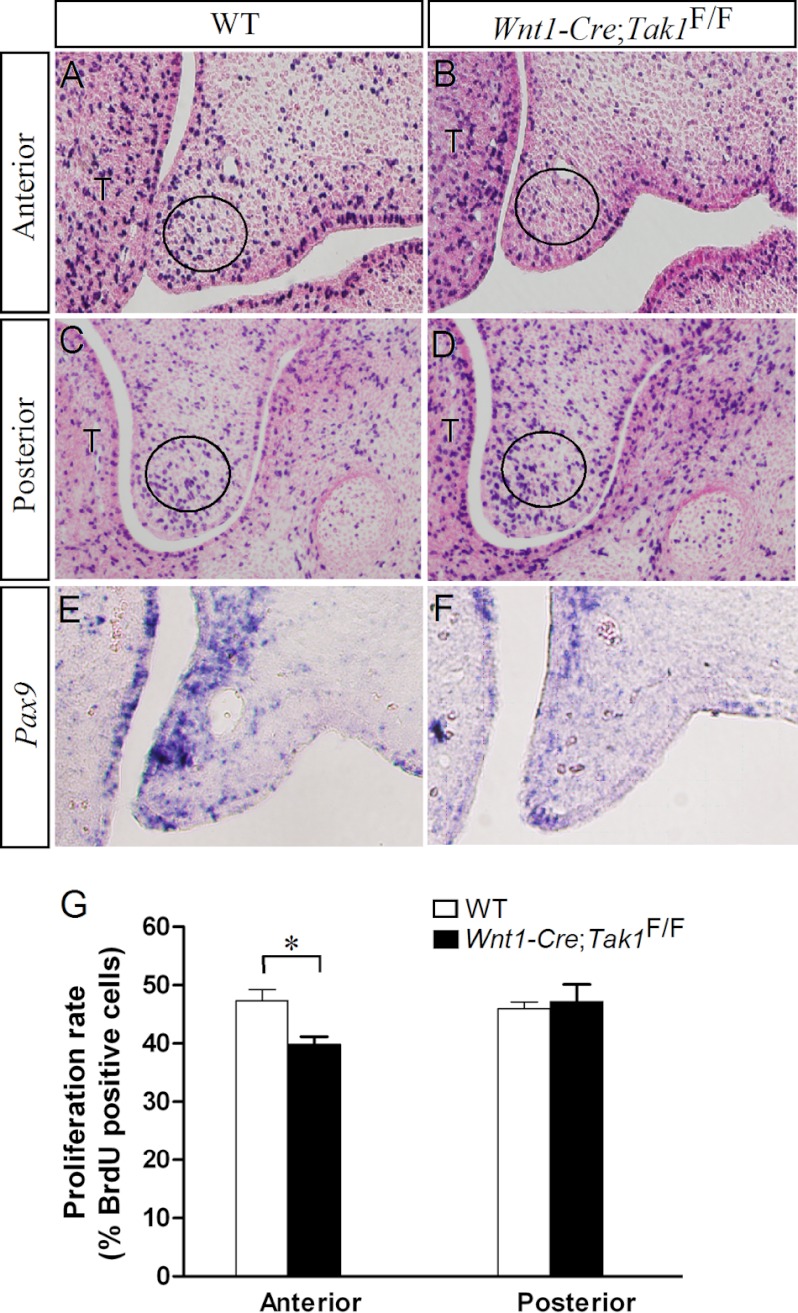
FIGURE 3.
Cell proliferation in the developing palate. A–D, BrdU labeling shows cell proliferation rate in E13.5 wild type control (A and C) and Wnt1-Cre;Tak1F/F (B and D) palatal shelves. The circles demarcate the arbitrary regions for counting total cells and BrdU-positive cells. E and F, in situ hybridization shows down-regulation of Pax9 in the palatal mesenchyme of E13.5 Wnt1-Cre;Tak1F/F embryo (E) compared with the control (F). G, comparison of the ratio of BrdU-labeled cells in the defined regions of the palatal shelves of E13.5 wild type and Wnt1-Cre;Tak1F/F embryos is shown. *, p < 0.05. T, tongue. Error bars, S.E.

