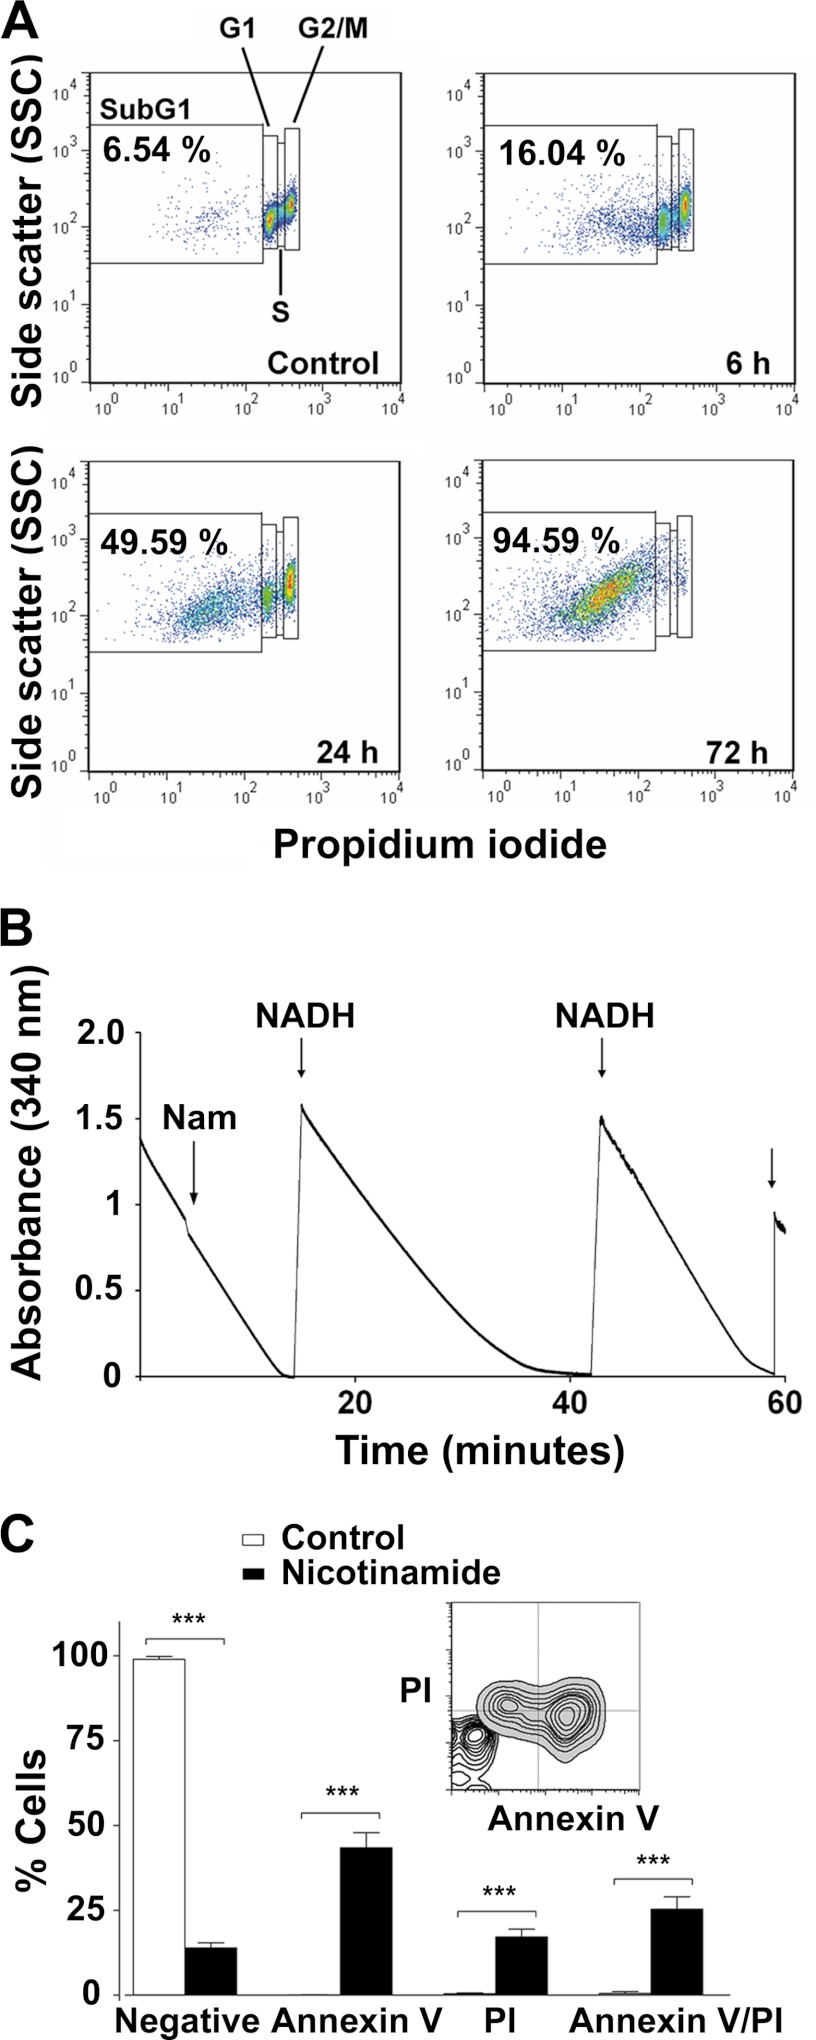
FIGURE 5.
Nicotinamide causes cell death in T. brucei. A, representative dot plots from FACS analysis to quantify the dead cell population (SubG1) after nicotinamide treatment. Percentages of the SubG1 population are the mean ± S.E. from three different experiments. B, pyruvate efflux measurement. Pyruvate production was quantified by monitoring the kinetics of NADH oxidation (absorbance at 340 nm). Nam, nicotinamide. C, FACS analysis of bloodstream forms stained with annexin V-FITC and PI. Error bars represent mean ± S.D. from three independent experiments. The percentages were determined using CellQuest software. Statistical significance was determined by Bonferroni's multiples comparison test between treated versus untreated cells. ***, p < 0.0001. A representative overlay dot plot to compare the different populations between treated and untreated trypanosomes was performed with FlowJo software.

