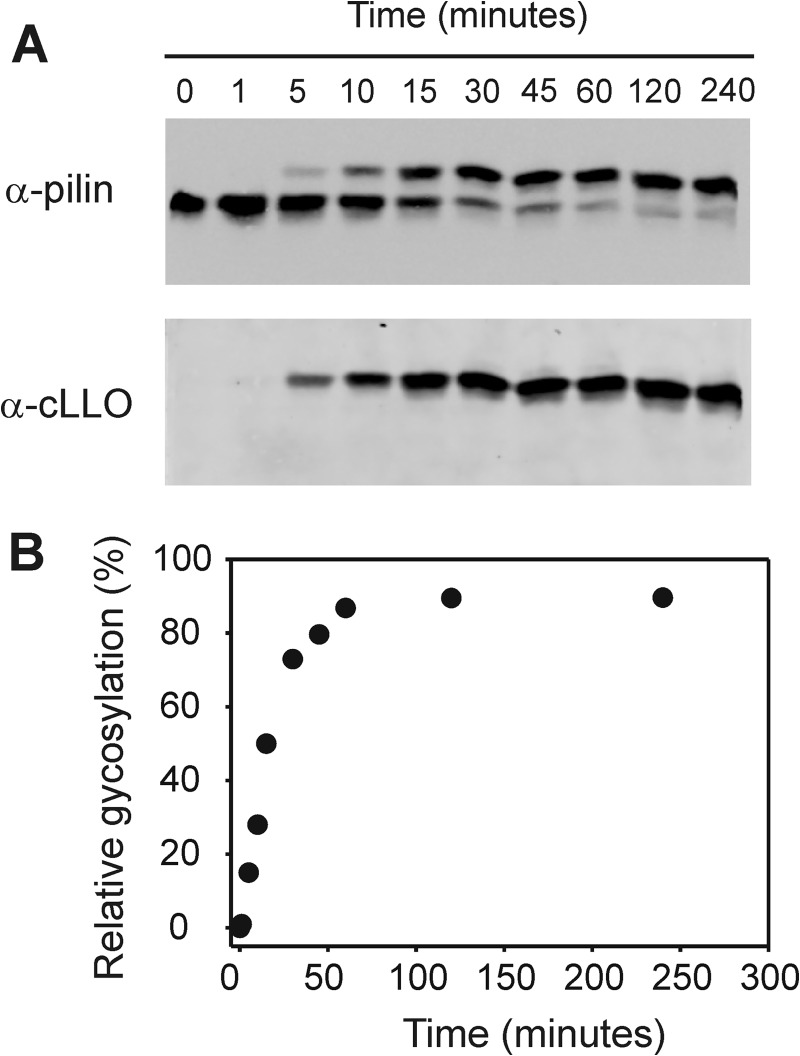
FIGURE 2.
Time course analysis of in vitro activity of PglL. A, Western blot of in vitro glycosylation assay after ending the reaction at the times indicated by adding 1× sample loading buffer containing 0.2% (w/v) SDS and immediate transfer to −20 °C. B, graph showing the relative glycosylation intensity as function of time.

