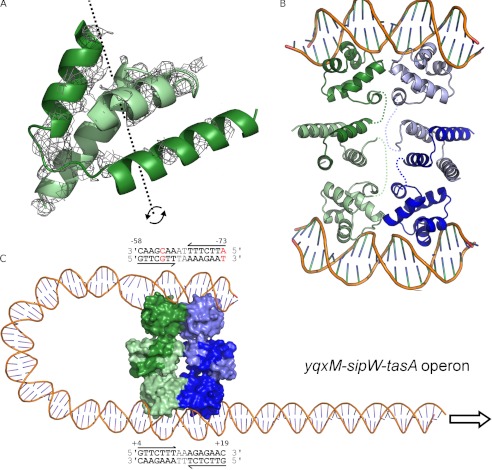
FIGURE 6.
SinR multimerization. A, likely position of the SinR C-terminal domain (residues 75–111). Unmodeled electron density features in the Fobs − Fcalc electron density map, shown in gray and contoured at 2.0 σ, reveal the position of SinR75–111. Positioning a single copy of SinR75–111 on top of this density feature (PDB 2YAL (11)) reveals that the crystallographic two-fold c axis (dashed black line and curved arrows) is coincident with the molecular two-fold axis of the SinR75–111 dimer. B, model of the SinR tetramer bound to two DNA duplexes. The tetramer is composed of dimeric units shown as light and dark shades of green and blue, respectively. The flexibility of the SinR C-terminal domains in the crystal, relative to the DNA binding domains, indicates that there will be dynamism between domains in solution. The connectivity within SinR protomers is indicated by colored dashed lines. C, model for the SinR-induced formation of a DNA loop at the yxqM-sipW-tasA operon, which contains two inverted repeats of the SinR consensus DNA binding sequence as indicated in the text boxes above and below the DNA duplex, with numbering relative to the transcription start site. The most upstream site contains two mismatches to the consensus, shown in red; however, the base at position 5 of the site commencing at −58 does not contribute to base-specific protein interactions with SinR.

