FIGURE 3.
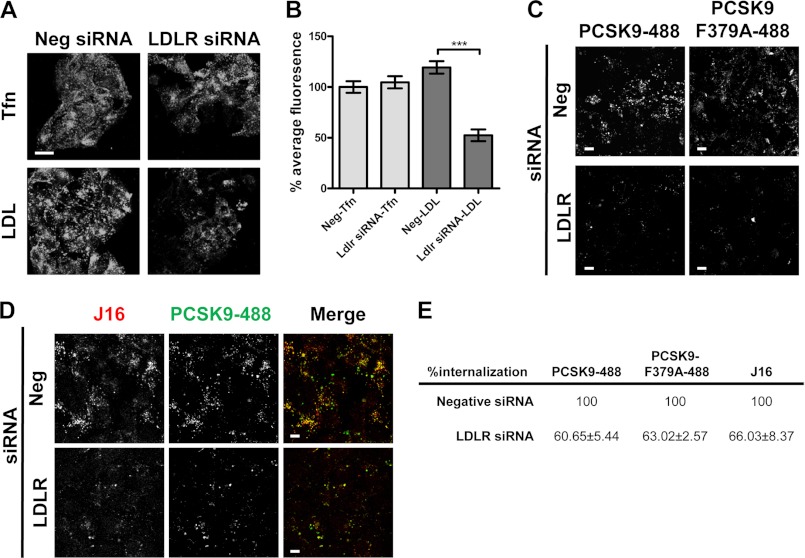
Transferrin, LDL, and PCSK9-488 internalization in LDLR siRNA-treated HepG2 cells. A, confocal microscopy of internalized transferrin-488 (Tfn) or LDL-BODIPY (LDL) in negative (Neg) or LDLR siRNA-treated HepG2 cells. Scale bars, 10 μm. B, quantification of A shown as the average percent intensity of negative siRNA cells with S.E. (error bars) from three independent experiments. C–E, internalized PCSK9-488 or PCSK9-F379A-488 (as indicated in C) or PCSK9-488/J16-647 (D) in negative control or LDLR siRNA-treated cells. Scale bars, 10 μm. Quantifications are shown in E as the average percent intensity of the negative control with S.E. from three independent experiments. ***, p < 0.0001.

