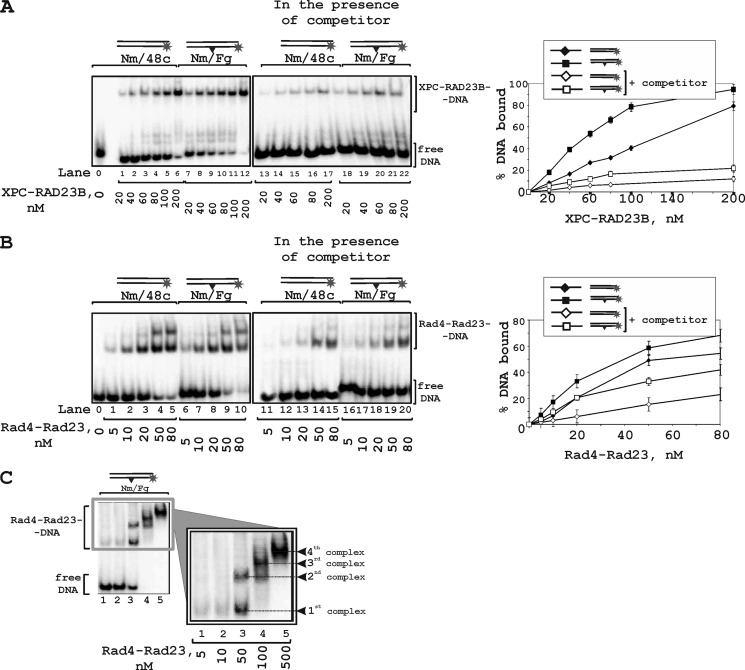
FIGURE 2.
Binding of XPC-RAD23B and Rad4-Rad23 to DNA analyzed by EMSA. The reaction mixtures (10 μl) contained buffer A, 10 nm 5′-32P-labeled DNA and the indicated concentrations of XPC-RAD23B (A) or Rad4-Rad23 (B). A schematic view of the DNA structures is presented at the top: triangle indicates the position of the bulky lesion. 5-Fold excess of nonradioactive undamaged 48-mer duplex was added in the reaction mixtures to compete with binding of the DNA studied. The right panels show the quantitative analysis of the data presented in the left panels. Error bars indicate the S.E. of five independent experiments. C, Rad4-Rad23-DNA complexes with different gel-shift mobility formed in the presence of protein excess.

