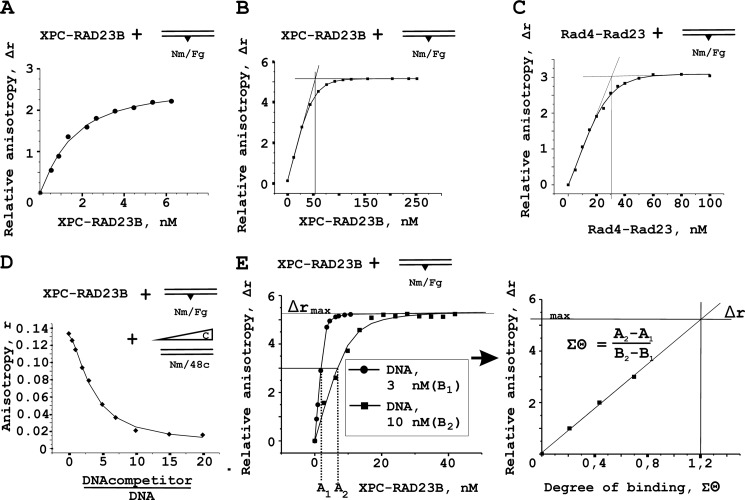
FIGURE 3.
Fluorescence anisotropy measurements of XPC-RAD23B binding to DNA. A, typical titration curve for XPC-RAD23B binding to fluorescein containing DNA (1 nm). Fluorescein group mimicking DNA damage was also used as a fluorescent probe. B and C, analysis of DNA binding activity of the XPC-RAD23B and Rad4-Rad23 protein preparations. The reaction mixtures containing 10 nm damaged DNA duplex were titrated by the increasing amounts of XPC-RAD23B (B) or Rad4-Rad23 (C). D, competition of the binding of the XPC-RAD23B complex to the fluorescent damaged DNA duplex (3 nm) by addition of undamaged DNA duplex. The reaction mixture contained increasing amounts of DNA competitor. Anisotropy values were plotted against the DNA concentration ratio. E, analysis of the stoichiometry of DNA-protein complexes under titration conditions. The left panel shows binding isotherms for 3 and 10 nm DNA. The right panels show quantitative analysis of binding isotherms presented in the left panels.

