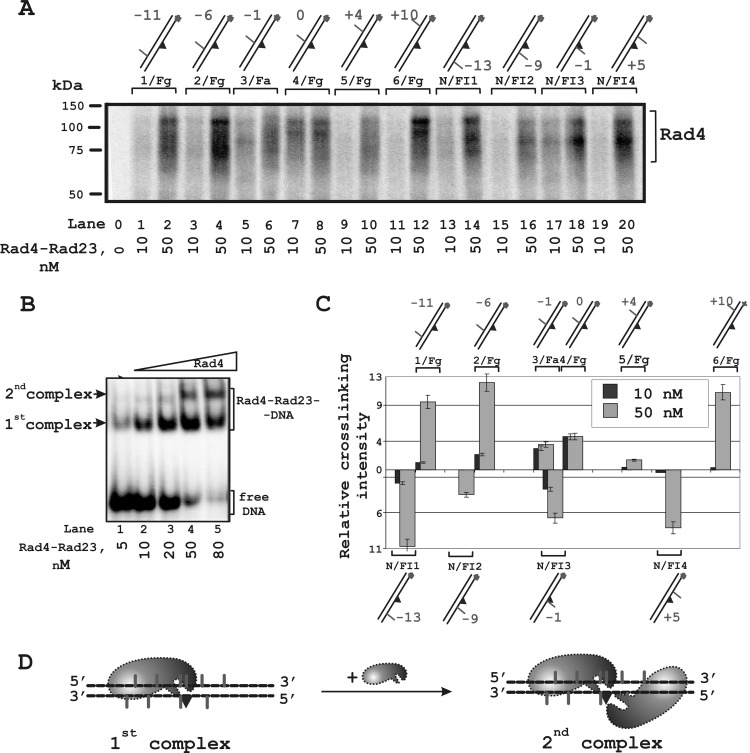
FIGURE 5.
Topography of the Rad4-Rad23 location on damaged DNA revealed by photocross-linking footprinting. A, the reaction mixtures (10 μl) contained buffer A, 10 nm 5′-32P-labeled photoreactive DNA and Rad4-Rad23 at the concentrations analyzed. DNA structures were the same as in the experiments with XPC-RAD23B. B, analysis of the Rad4-Rad23-DNA binding product formation. The reaction mixtures (10 μl) contained buffer A, 10 nm 5′-32P-labeled photoreactive DNA, and the indicated concentrations of Rad4-Rad23. C, quantitative analysis of the data from A for 10 nm and 50 nm protein concentrations. The relative intensities of the protein-DNA adducts were plotted against the 5I-dUMP positions in the DNA. Averages and experimental errors were taken from at least three experiments. D, localization of Rad4-Rad23 on a damaged DNA duplex according to photocross-linking intensity maximum.

