
Fig 2.
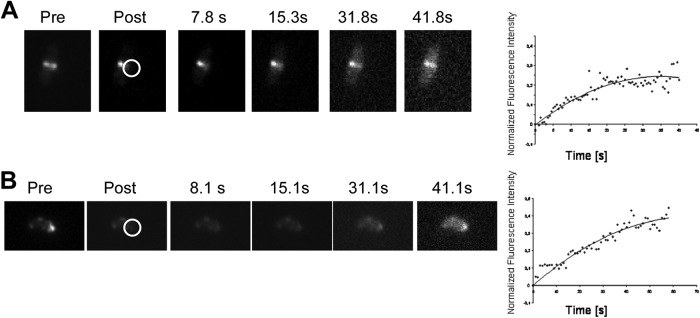
FRAP experiment on FtsZ-GFP-expressing H. pylori 1061 cells. (A) FRAP of the H. pylori Z ring. (B) FRAP of polar FtsZ foci. The right side shows one representative FRAP time series, and the left side demonstrates the mean value of the normalized fluorescence intensity plotted against time of at least five independent experiments. pre, before bleaching; post, after bleaching. Seconds after bleaching are indicated. Circles indicate the area of bleaching.