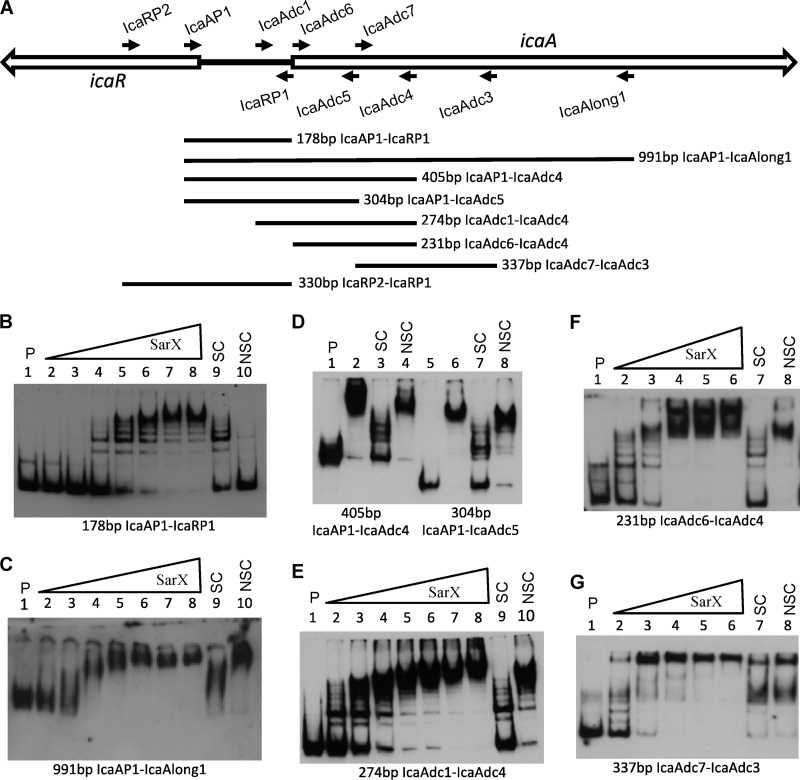
Fig 3.
SarX binding to ica DNA and localization of the SarX binding region. (A) Locations of ica primers. Forward primers are listed above the genetic map, and reverse primers are listed below the map. PCR DNA fragments for use in EMSAs are shown in the lower portion of the figure. (B to G) EMSAs, with each of the different labeled PCR fragment probes indicated below the figure. P indicates labeled probe without SarX; SC and NSC indicate specific and nonspecific competitors, respectively, each at 50 molar excess. All assays were run on 5% acrylamide gels except that shown in panel C, which was on a 4% gel. The amounts of SarX in each assay are shown below. (B and C) Lanes 2 to 10 were 5.2, 15.3, 45.9, 138, 407, 814, 1,628, 407, and 407 nM, respectively. (D) Lanes 2 to 4 and 6 to 8 were all at 407 nM. (E) Lanes 2 to 10 were 25.4, 50.9, 102, 204, 407, 814, 1,628, 407, and 407 nM, respectively. (F and G) Lanes 2 to 8 were 52.0, 153, 407, 814, 1,628, 407, and 407 nM, respectively.

