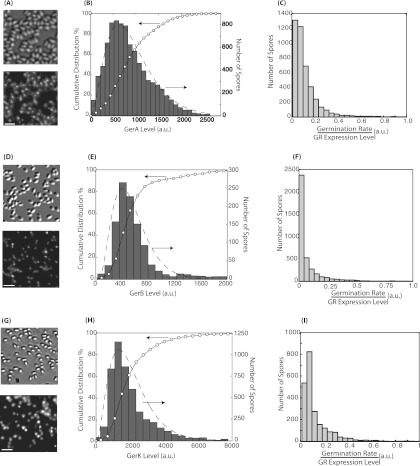
Fig 1.
Quantification of the stochastic expression of GerA (A to C), GerB (D to F), and GerK (G to I). Bright-field (top) and fluorescence (bottom) images of KGB174 (A), KGB202 (D), and KGB08 (G) spores show the clustered localization of the GRs and variations in GR expression levels among spores. Bar, 3 μm. The distributions of GerA (B), GerB (E), and GerK (H) expression levels in individual spores were quantified from the analysis of the fluorescence intensities of individual spores. The histograms of the GR levels are plotted with gray bars (right axes). The open circles represent the corresponding cumulative distributions (left axes). The dashed lines are the maximum likelihood fit to a Gamma distribution function. The distributions of the ratio of the germination rate and the GR expression level measured for individual spores are shown in panels C (l-valine germination rate/GerA expression level), F (AGFK germination rate/GerB expression level), and I (AGFK germination rate/GerK expression level). The broad distributions in panels C, F, and I indicate that the relationship between the germination rate and GR levels cannot be modeled by a simple linear function.

