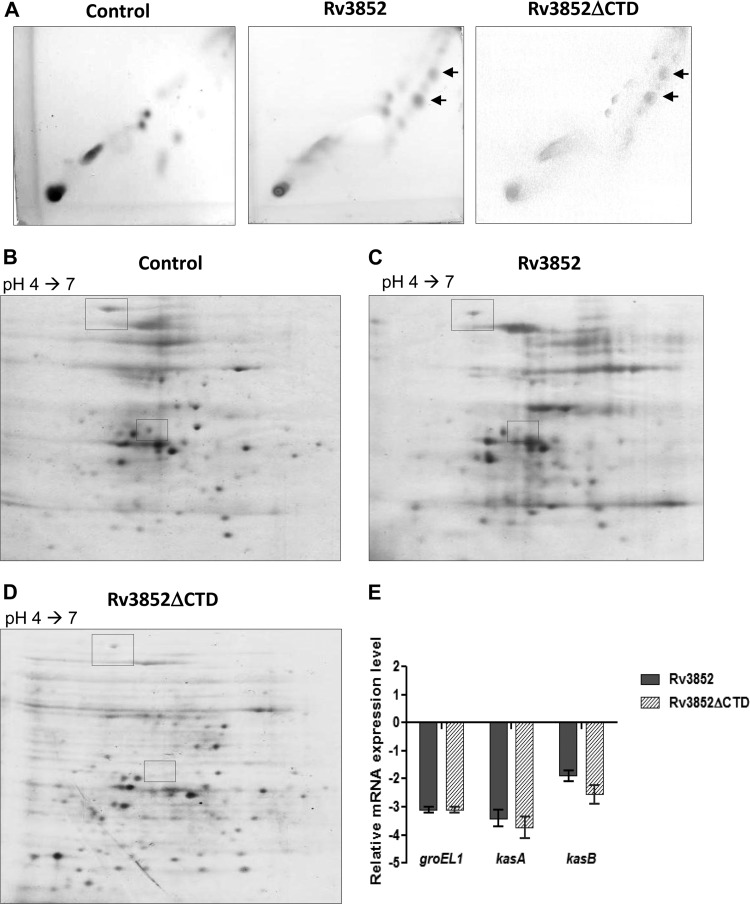
Fig 6.
Effect of Rv3852 expression on the M. smegmatis lipid profile and proteome. (A) 2D-TLC profile of apolar lipids developed with chloroform-methanol (96:4; three times) in the first dimension and toluene-acetone (80:20) in the second dimension. The arrow indicates the lipid spots, which are more intense in Rv3852- and Rv3852ΔCTD-expressing cells. (B to D) Analysis of the total proteome profile of M. smegmatis cells. The boxes indicate the protein species present at reduced levels in the Rv3852- and truncated-protein-expressing cells relative to the control. (E) Relative expression profile of groEL1, kasA, and kasB in Rv3852- and Rv3852ΔCTD-expressing cells as determined by qPCR. The cycle threshold (CT) value of each gene was normalized with the housekeeping gene rpoB. The error bars indicate standard deviations.

